In financial markets, yield curves serve a critical role in defining how likely expected alterations in the policy interest rate are in practice and what additional changes they trigger along the way. Throughout its way to maturity, an issued bond will provide traders with fixed-interest rewards. The directions of the yield and the prices for buy-and-sell orders for the target asset are the opposite, but the change in the interest will make it more valuable. From this perspective, getting to know more about yield curves means uncovering hidden financial opportunities and underestimated bonds in the market.
What You Should Remember About Yield Curves
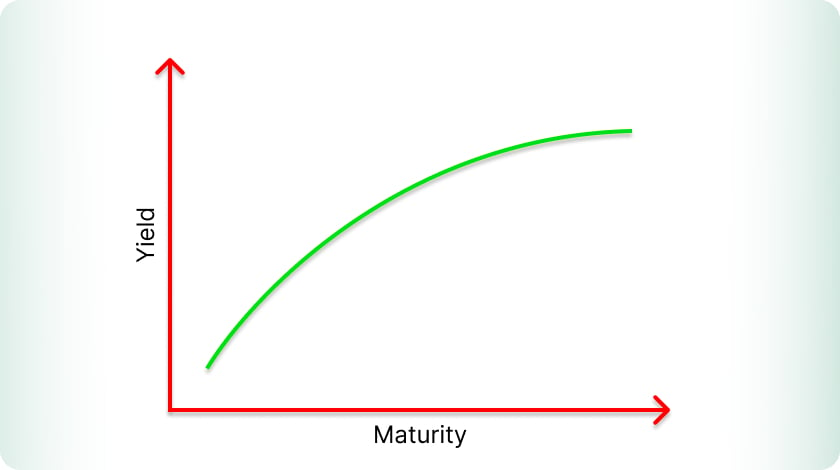
What is a yield curve? Interest rates on debt for several maturities in the market can be visually represented by this means. This graph represents the prospective reward of an investor if they decide to lend a certain sum for a given time. It consists of two axes — maturity is displayed across the horizontal axis while a bond’s yield itself on the vertical one.
How to Utilize the Yield Curve Potential in Financial Analysis
To benefit from yield curve bonds in your trading and investment strategy, take into account the following practices:
- Inflation hedging — spot rising formations and invest in TIPS and other inflation-protected securities in this instance.
- Credit risk assessment — if you locate inverted or steep yield curves, it may signal credit market stress. It would be advantageous to adjust exposure to high-yield debt and corporate bonds so as not to suffer from the economic uncertainty momentum.
- Bond portfolio diversification and optimization — structure a balanced portfolio with several bonds thanks to yield curve analysis, opting for targeted returns while allocating bonds with the desired maturities.
- Investment risk tolerance — manage arising risks properly by figuring out how yield curves showcase interest rate fluctuations and other pieces of information. This way, it will be simpler to align your portfolio to inflation expectations, central bank policies, and so on.
Different Yield Curve Variations to Consider
The bond’s rises and falls are easier to track once you categorize those movements. Keep on reading for more awareness of what such differences mean.

| Type |
Description |
Market Implications |
Investor Interpretation |
Economic Stage |
| Normal |
Upward-sloping, long-term yields higher than short-term |
Economic growth, healthy demand for long-term bonds |
Confidence in the economy, inflation expectations |
Expansion or growth |
| Inverted |
Downward-sloping, short-term yields higher than long-term |
Recession signal, the market expects lower rates |
Concerns over future economic performance |
Economic slowdown or recession |
| Steep |
A large difference between short-term and long-term yields |
Anticipates strong growth, rising inflation |
Optimism about the economy, higher inflation |
Early recovery or expansion |
| Flat |
A small difference between short-term and long-term yields |
Uncertainty or transition phase |
Market indecision, balanced expectations |
Transition period |
| Humped |
Low short- and long-term yields, higher medium-term |
Expectations of rate changes or economic concerns |
Anticipation of medium-term events or policy shifts |
Economic shock or uncertainty |
Defining Yield Curve Theories
Getting a deeper insight into the topic is possible with yield curve theory analysis. That’s how you can check the reasons before the most popular formations in this category and streamline your performance in the market. It also comes in handy for data-driven decision-making related to future predictions of the monetary and economic conditions in the field.
| Theory |
Core Idea |
Strengths |
Limitations |
| Pure Expectation Theory |
The yield curve reflects market expectations for future interest rates. |
Explains short-term yield changes effectively |
Ignores reinvestment risk and interest rate risk |
| Liquidity Preference Theory |
Long-term securities carry a liquidity premium due to higher risk. |
Accounts for the risk of holding long-term debts. |
Assumes a consistent preference for short-term trades |
| Segmented Markets Theory |
Short- and long-term markets operate independently, with separate supply-demand forces. |
Recognizes distinct investor preferences |
Fails to explain yield curve inversions |
| Preferred Habitat Theory |
Investors demand a premium to invest outside their preferred time horizons. |
Explains long-term yields exceeding short-term. |
Overemphasis on horizon-specific behavior |
Factors That Influence Yield Curve Analysis
Market expectations and economic aspects altogether have a stronger impact on how yield curves are formed and function than they might seem at first. These pieces of information will provide you with valuable insights on how to anticipate upcoming changes in bond pricing and interest rates without missing out on capitalization opportunities.
| Factor |
Impact on Yield Curve |
Key Considerations |
| Economic Growth |
Strong growth steepens the curve; slow growth flattens or inverts it. |
Reflects investor confidence and future demand |
| Inflation Expectations |
Higher inflation expectations push long-term yields upward. |
Central to pricing long-term bonds |
| Monetary Policy |
Tightening flattens or inverts the curve; easing steepens it. |
Central banks’ rate decisions are critical |
| Investor Sentiment |
Risk aversion lowers short-term yields; risk appetite may raise long-term yields. |
Reflects demand for safe or high-yield assets |
| Global Market Conditions |
Foreign interest rates and capital flows can influence domestic yield curves. |
Particularly relevant for open economies |
The Role of Yield Graphs in Trading and Investing
Without a doubt, the shape and movement of yield curves help interested parties adjust their performance strategies and advance their progress with data-driven insights. They function as crucial tools to define and analyze economic expectations and market conditions, including broader asset allocations, interest rate yield curve derivatives, and more.
| Aspect |
Role in Trading and Investing |
Key Takeaway |
| Market Sentiment Indicator |
A steep curve signals growth; an inverted curve warns of potential recession. |
Guides timing of asset purchases or sales |
| Bond Pricing |
Helps determine the fair value of bonds across maturities |
Influences portfolio yield management |
| Interest Rate Forecasting |
Predicts future short-term and long-term interest rate trends |
Shapes expectations for rate-sensitive assets |
| Hedging Strategies |
Informs hedging decisions using derivatives like swaps and futures |
Mitigates risk from rate fluctuations |
| Asset Allocation |
Determines optimal investment mix based on economic phases signaled by the curve |
Balances risk and return |
Yield Curve Risks and Limitations to Consider in Bond Markets
The summary of factors to use yield curve with caution and attention to detail won’t be complete without the following:
- interest rate risks caused by unexpected shifts in central banks’ policies;
- outdated, poor-quality, or limited market details leading to yield curve misinterpretations;
- the risk of not fully capturing the impact of information on longer trades, underestimating or overestimating the target bond’s performance;
- exaggerated curve fluctuations within illiquid bond markets that make trading and investment choices more challenging;
- reinvestment risks;
- the need for top-notch and precise modeling and trade execution in the case of hedging strategies, which may not go hand in hand with what’s going on in the target market;
- segmented data behaviors.
Final Thoughts
Yield curve bonds function as an informative indicator of how profitable the target deal may become, letting you adapt your strategy to future inflation and interest rates, as well as economic growth. With historical data and demo accounts, your practice can harvest genuine results rather sooner than better while staying within the desired risk tolerance zone.