Getting to know the market gap definition will help you expand the range of available trading tools and techniques for your portfolio. Specifically, this approach lets you exploit the bridge between the closing and opening prices of two different trading days. Stay tuned to find out more about gaps in Forex charts and possible applications in trading.
The Role and Significance of Gaps in Market Analysis
Boost your ability to identify market sentiment and benefit from its fluctuations with well-informed decisions made thanks to gaps in the stock’s price:
- One of the factors behind such gaps is the institutional influence, which assists in understanding the big picture.
- It reflects market psychology and how the price fluctuates in response to events like earning reports.
- A gap lets you confirm the trading volume and patterns to choose the right performance style.
Stock Gaps Definition: What Does Gap Mean in Trading and Technical Analysis?
The gap theory in stock markets implies the difference between the asset’s price levels during two consecutive trading days, namely, the closing and opening cost rates. On charts, this sort of formation is displayed as a discontinuous and non-filled-in space. Distinctive types of gaps offer individual signals to investors and traders.
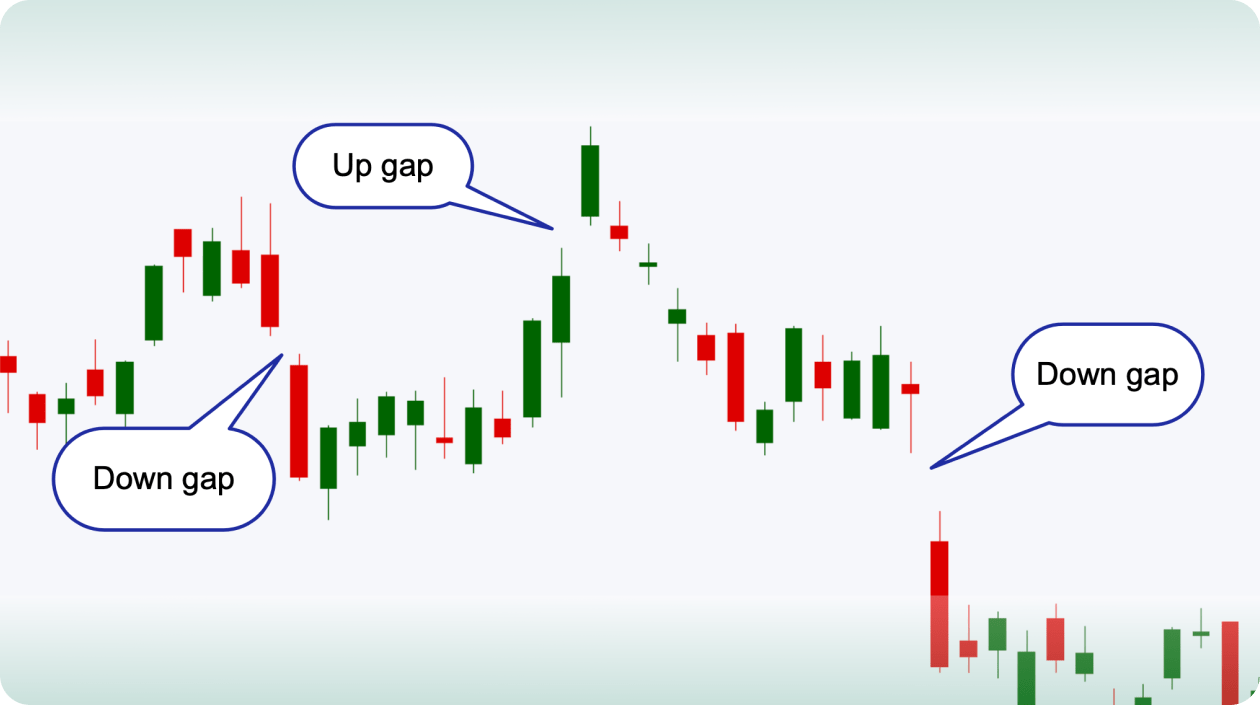
Upward and Downward Stock Price Gaps
Although there are several kinds of gaps based on the details of their occurrence, the major two classes vary in terms of the associated price motion direction:
- Upward stock trading gaps correspond to the bridge in the prices, when the closing one is at its lowest and the opening one is significantly higher in comparison.
- On the other hand, the lower price after the next trading day starts, preceded by its higher rate on the scale, signifies a downward gap.
In turn, their impact on the market and its behavior doesn’t coincide:
- Upward gaps technical analysis can function as bullish signals, indicating strong buying interest and a trading volume that is higher than average. The gap level will serve as a new support level.
- Downward gap stock trading functions as a bearish signal, confirming stronger selling pressure. In this case, the gap level will function as a new resistance level.
Exploring the Efficiency and Significance of Trade Gaps in Technical Analysis
Not every price gap matters and can be defined in advance. It is crucial to remember the efficiency of stop-loss orders and other risk assessment and management strategies in the market. To properly apply the findings of market sentiment and psychology via gaps, you will need to confirm those with other technical indicators first — the RSI, MACD, and others.
Chart Gaps & Market Psychology & Price Movement Analysis
In several trading scenarios, technical gaps are associated with outer market events and news, which may have a heavy impact on investors. For example, a poor earnings report may lead to a drastic increase in the security’s sales. Here are a few behavioral patterns behind chart gaps to identify and exploit in your trading tactics:
- Herding — the market trend is amplified when investors stick to the strategy preferred by others and promote the initial price movement.
- Opportunistic purchases — enthusiasts can increase their profits by sponsoring upward gaps after positive earnings or other sorts of news from the target company.
- Risk aversion — if the platform’s or brand’s news isn’t quite pleasant, it may disrupt the initial money flow and trigger more sales. Skilled traders can use those periods to purchase promising assets at cheaper prices and sell them later when the price returns to its pre-gap rate.
- Fear and greed — a lot of inexperienced traders rely on emotional urges to sell or buy assets, which causes rapid fluctuations in market sentiment and is reflected by gaps between the prices during two consecutive trading days.
Trading Gaps vs. Market Trends and Investor Sentiments
Numerous factors can trigger gaps in stock charts. So getting to know about such aspects and a corresponding market reaction (e.g., volume surge and immediate price movement) can help you plan your trading deals better and increase the potential financial feedback from them. Usually, bearish down gaps and bullish up gaps can form daily. In contrast, there are scenarios when gap technical analysis suits weekly and monthly charts too. Focus on the bridging moments — the start and end of the week or month.
Discovering the Variety of Gaps in Trading
There are five fundamental types of gaps in stock trading:
- exhaustion;
- runaway;
- common;
- breakaway;
- island.
Let’s define their nature and peculiarities in more detail.
Exhaustion Gaps in Stock Charts
Here are the key elements of exhaustion gaps:
- Volume — the price move stands out with a significant increase in volume.
- Occurrence — it takes place closer to the current trend’s final stage. Otherwise, it may occur at crucial levels of resistance or support.
- Price movement — its motion can indicate either a downtrend or an uptrend when it makes the final blow to decrease or increase, accordingly.
- Confirmation — the price motion direction reverses and closes either higher for a downtrend or lower for an uptrend.
You can spot this type of gap in stock charts if you witness the asset’s increase in volume and price while the difference between the closing rate of the previous day and the new opening cost is drastic. Analyze the features of exhaustion gaps for two different contexts in the table below.
| Downtrend |
Uptrend |
- no new lows after the gap;
- increased volume;
- higher closure when the prices reverse
|
- no new highs after the gap;
- price and volume increasing;
- lower closure after the prices reverse
|
Common Gaps in Trading
They are typical for intraday sessions and market openings. In the post-gap period, experts track a low trading volume. These gaps are more frequent than alternative variables since they are caused by standard in-market behavioral forces. Unlike other gaps, they don’t remain unfilled for long and demonstrate rather neutral market sentiment with potential weakness in the prevailing trend. The key benefit in determining such patterns lies in improving your understanding of consolidation and market ranges.
Island Trading Gaps in a Nutshell
The term is quite metaphoric since it represents a gap that takes place between two consecutive stock gaps. During the formation stage, you will also spot an increase in the trading volume. There are two types to distinguish:
- With one gap down and the next one up, the island gap will be bullish.
- With the first gap up and the following one down, the island gap will be bearish.
Although it isn’t as frequent as common and other formations in the market, such signals can provide crucial hints for successful trading decisions:
- In the case of a bullish island reversal gap, investors can win by entering long positions.
- When it comes to a bearish island reversal gap, short positions will be safer and more profitable.
Breakaway Gap Definition
You can recognize this type of gap by the parameters below:
- Occurrence and confirmation — it signifies the start of a new trend and can be confirmed by an increased volume after the gap takes place.
- Price movement — the gap takes place over resistance or support levels.
- Profitability — it demonstrates a strong and influential momentum in the gap’s direction, which can lead to the most profitable deals with the use of gaps in stock trading.
Although it is similar to a breakout pattern, the difference lies in the speed it gets filled — it doesn’t happen momentarily in the case of breakaway gaps. There are pretty strict conditions to when their occurrence is possible:
- The increase in volume in the post-gap phase is a must. The direction change depends on the market trend prevailing.
- Its conditions aren’t overbought or oversold, but the number of interested parties has to be significant for a prospective breakaway gap to occur. A downward gap requires a large audience of sellers, while an upward alternative is predetermined by the number of buyers.
What Is a Gap Runaway Type?
Identifying and understanding this version of gaps in trading will open the doors to more impactful insights for making well-thought-out and profitable decisions with clear entry and exit points. Here are the features defining a runaway gap in technical analysis:
- It typically aligns with the current trend, which is uninterrupted and strong in its effect and motion.
- The post-gap period can validate investor sentiment by a drastic increase in the volume of deals made in the market.
- There are two possible versions — boosted liquidation during a downtrend or delayed entry during an uptrend.
- In the case of a downtrend context, the gap appears lower than the closing price from the previous day and results in consistent lower lows.
- It is the opposite of the uptrend scenario — higher highs and a gap occurring above the closing price from the previous trading day.

Factors and Scenarios Behind the Occurrence of Trading Gaps
Now is the right moment to explore the catalysts triggering the formation of gaps in the market. Overall, there are three basic causes of this phenomenon in the stock’s price motion:
- High volume — it is a typical feature for any version of gaps, which signifies a corresponding stock of a certain security, commodity, or another asset. Differences between the closing and opening prices are frequent when the trading day comes to an end and the next one begins.
- Low liquidity — the market doesn’t have enough participants to prevent sudden price fluctuations, i.e., it is short on liquidity.
- Earnings — the bigger picture in the market should never be underestimated. Gaps can happen since the company’s or exchange platform’s news motivates or discourages buying or selling pressure, impacting the overall investor sentiment.
Trading Strategies with Gaps Stock in Mind
Don’t hesitate to turn the occurrence of gaps into money-earning opportunities, especially in highly volatile markets. Although most of the gaps take place unexpectedly, you can distinguish them from price patterns by the speed of filling in after the sudden change in the asset’s cost.
The selection of trading techniques to check includes the following:
- Try trading against the direction of the stock’s gap, benefiting from a reversal that will take place when the asset returns to its previous price ratio.
- Invest a security after the closing happens if you predict a gap to happen after the market opens the following day. Consider whether there are any favorable reports about the company’s earnings in this case.
- Wait for the moment when the post-gap phase is over with the price going back to the pre-gap price level to make a trading operation that aligns with the general gap’s direction.
For any strategy from the list, it is crucial to define the support and resistance levels of the target stock, as well as place stop-loss orders to prevent financial disappointment if your judgment isn’t perfect. Classify the spotted gap to understand whether it showcases the trend continuation or reversal.
Wrapping It Up
At the end of the day, the use of gaps as a high-quality information source and trading signal will be a worthwhile strategy for more seasoned members of the community. There are different nuances their practical applications require, including their unexpected nature that depends on the big picture in the market a lot. Seasoned traders and investors can employ the gaps stock trading instrument as a complementary device, but it is more suited as a method to analyze the market and determine the shift in its sentiment and end-user behavior.