Every Trader Goes Through the Indicator Phase
Open almost any beginner’s trading chart, and you’ll notice something curious. Price is often the least visible element on the screen.
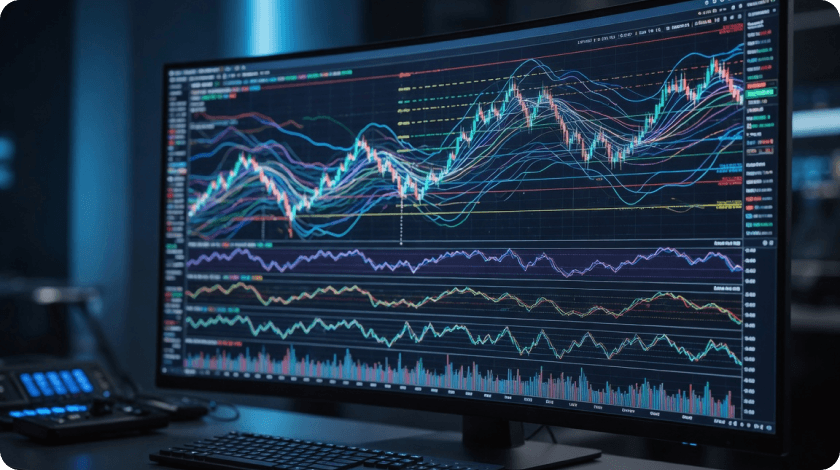
Instead, it’s buried beneath layers of coloured lines, oscillators and arrows. RSI flashes below the chart. MACD sits underneath it. Bollinger Bands wrap around every candle, while moving averages crisscross the screen in different colours. Add the Stochastic Oscillator, Fibonacci retracements and an ATR indicator, and the chart begins to resemble the cockpit of a commercial aircraft.
For many traders, this doesn’t feel excessive. It feels professional.
There’s a widespread belief that every additional indicator removes a little more uncertainty from the market. If one signal is useful, then surely three signals must be better. Five should be even safer. After all, making decisions based on multiple confirmations sounds more disciplined than relying on a single chart.
It’s an intuitive idea — and one of the most persistent myths in retail trading.
The reality is that most indicators don’t provide independent confirmation at all. Many are simply different mathematical interpretations of the same price data. They may look unique, use different colours and appear in separate windows, but they’re often describing the same market behaviour with a slight delay.
As traders add more indicators, they rarely gain new information. More often, they gain the illusion of certainty.
Ironically, the search for confirmation can make decision-making slower, more emotional and less consistent. Traders spend more time waiting for every signal to align than evaluating whether the trade itself still offers an edge.
Professional traders understand this distinction. They don’t ignore indicators, but they rarely judge a setup by the number of tools pointing in the same direction. Instead, they focus on whether each piece of information contributes something genuinely different to the decision.
The difference may sound subtle, but over hundreds of trades it changes how strategies are built, tested and executed.
Why Traders Keep Adding Indicators
Indicator overload doesn’t happen because traders are careless. In fact, it usually begins with good intentions.
Every new trader eventually experiences the same frustration. A setup looks perfect, the trade is placed with confidence — and the market immediately moves in the opposite direction.
The natural conclusion is that the entry wasn’t properly filtered.
So another indicator is added.
The next trade performs better, reinforcing the belief that the additional confirmation improved the strategy. A few losing trades later, another indicator joins the chart. Then another.
Without noticing it, the trader begins solving every problem in the same way: by adding another layer of analysis.
This behaviour isn’t unique to financial markets. Psychologists describe it as a tendency to seek more information whenever we feel uncertain, even if the new information doesn’t improve the quality of the decision. More data creates the feeling of greater control, which is psychologically comforting — even when it doesn’t increase predictive accuracy.
Financial markets amplify this effect.
There are thousands of freely available indicators, each promoted as the missing piece of the puzzle. Social media is filled with screenshots of trading setups that combine moving averages, oscillators, volatility measures and proprietary indicators into systems that appear highly sophisticated.
Complexity becomes a proxy for expertise.
The irony is that markets themselves remain remarkably simple. Every indicator — without exception – is derived from price, volume, or time. None of them can predict information that doesn’t already exist within the market data.
Adding more indicators therefore doesn’t necessarily mean gathering more evidence. Often, it simply means processing the same evidence several times in different mathematical forms.
The Illusion of Confirmation: When Three Indicators Tell You the Same Story
One of the biggest misconceptions in technical analysis is the idea of “multiple confirmations.”
At first glance, waiting for three indicators to agree appears to reduce risk. If RSI is oversold, MACD has crossed upward and a moving average confirms the trend, the trade should be more reliable than relying on a single signal.
The logic feels convincing.
The problem is that these indicators are rarely independent.
Take RSI, MACD and a standard moving average. They look different, calculate different values and occupy different areas of the chart. Yet all three are derived from the same underlying input: historical price movement.
In other words, they are different mathematical lenses looking at the same data.
Imagine asking three weather forecasters whether it will rain tomorrow. If all three use the same forecast model, hearing the same prediction three times doesn’t increase its accuracy. It simply repeats the same conclusion through different voices.
Trading indicators often work in much the same way.
A moving average highlights the direction of recent prices. RSI measures the speed and magnitude of those same price changes. MACD compares moving averages calculated from the same price series. Their formulas differ, but the raw material remains identical.
When all three align, traders often interpret it as independent confirmation.
In reality, they’re frequently observing the same market condition expressed in different ways.
This distinction matters because it creates a false sense of confidence. A trader may believe a setup has been validated by several independent signals, when in fact the analysis rests on a single source of information repeated multiple times.
The result is often slower decision-making rather than better decision-making. Opportunities are missed while traders wait for every indicator to line up perfectly, and by the time they do, much of the move has already taken place.
Professional traders rarely ask, “How many indicators agree?”
A more useful question is, “Does each tool tell me something I didn’t already know?”
That shift in thinking separates confirmation from duplication — and it’s one of the simplest ways to build a cleaner, more objective trading process.
How Professional Traders Actually Use Technical Indicators
There’s a common assumption that professional traders have access to better indicators than everyone else.
They don’t.
Institutional traders, hedge funds and experienced systematic traders use many of the same tools available in MetaTrader or TradingView. The difference isn’t the indicator itself—it’s the role that indicator plays within the decision-making process.
Retail traders often ask, “Should I buy or sell?”
Professionals ask a very different question.
“What does this indicator measure, and does it add information I don’t already have?”
That distinction changes everything.
A moving average might help define the broader trend, but it won’t determine whether a trade should be opened. ATR can provide context about volatility, but it doesn’t predict future direction. RSI may identify stretched momentum, yet experienced traders know that strong trends can remain overbought or oversold far longer than most beginners expect.
Each tool answers one specific question.
None answers every question.
Professional trading isn’t about stacking confirmations until every indicator agrees. It’s about combining different sources of information that complement one another rather than repeat the same conclusion.
Price structure, market context, liquidity, volatility, and risk management often carry more weight than any oscillator on the screen.
That’s why many experienced traders work with surprisingly clean charts. Fewer visual distractions make it easier to focus on the factors that genuinely influence a trading decision.
Ironically, charts often become simpler as traders become more experienced.
Indicator Overload Creates the Illusion of Better Decisions
Every technical indicator adds another variable to the decision-making process.
At first, this seems like an advantage. More information should lead to better decisions. In practice, the opposite often happens.
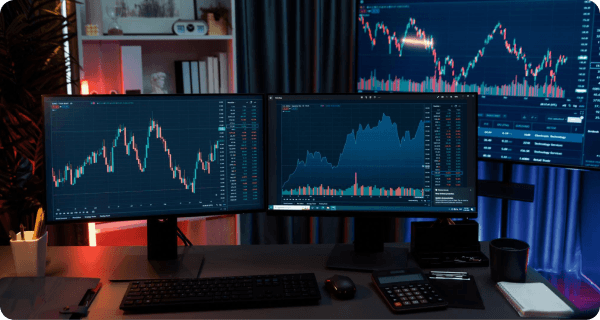
Imagine a trading strategy that requires confirmation from six different indicators before entering a position. A moving average must point higher. RSI needs to leave oversold territory. MACD has to complete a bullish crossover. Bollinger Bands should begin expanding. ATR must confirm rising volatility. Volume also needs to exceed its recent average.
Each condition sounds perfectly reasonable in isolation.
The problem is that financial markets are constantly changing. These signals rarely appear at the same moment. By the time the final indicator confirms the setup, price may already be far from the original entry, the risk-to-reward ratio has deteriorated, or the opportunity has disappeared altogether.
This creates a subtle but important shift in how traders make decisions. Instead of evaluating the market, they begin evaluating their indicators.
The chart itself becomes secondary. The trader is no longer asking, “Is this a good trade?” They’re asking, “Have all my indicators finally agreed?”
That’s a dangerous distinction.
Markets don’t wait for perfect confirmation because no such thing exists. Every trade is made under uncertainty, and every indicator is based on historical price data rather than future information. Waiting for complete agreement simply delays action without removing risk.
Perhaps the highest cost of indicator overload isn’t missing a single trade. It’s losing consistency. If every position depends on half a dozen technical conditions aligning perfectly, traders inevitably begin making subjective exceptions. One day they ignore a weak RSI reading because the trend looks strong. The next day they reject an almost identical setup because MACD hasn’t crossed yet.
Over time, the strategy stops being rule-based and becomes discretionary, making it far more difficult to evaluate whether it actually has an edge.
Professional traders understand that consistency doesn’t come from increasing the number of filters. It comes from defining a small set of meaningful criteria and applying them the same way, trade after trade. The objective isn’t to eliminate uncertainty — it’s to build a process that performs reliably despite it.
Why Execution Quality Matters More Than One More Oscillator
There’s another reason why traders become obsessed with indicators.
Indicators are visible.
Execution isn’t.
You can spend hours adjusting RSI settings from 14 to 12, optimising moving averages or testing new oscillators because those changes are easy to measure.
Infrastructure is different.
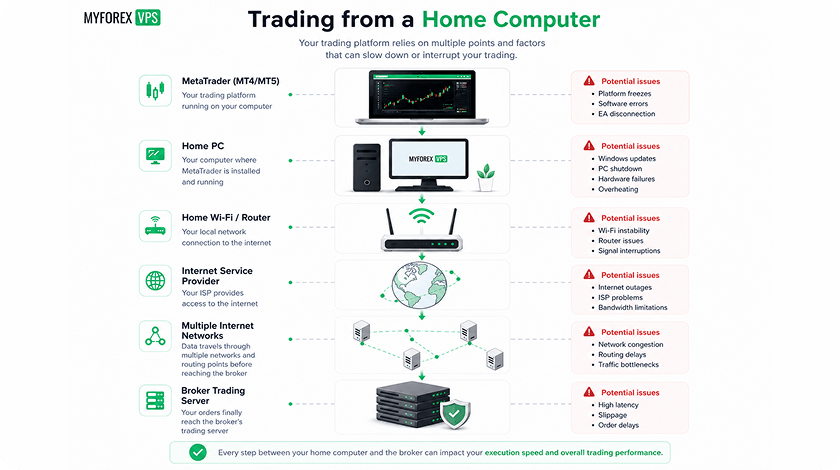
Few traders think about execution speed, network latency or platform stability until something goes wrong.
Yet these factors influence every single trade.
Imagine two traders using the same strategy, the same broker and the same risk management rules.
One executes trades from a stable low-latency environment running continuously on a dedicated VPS.
The other trades from a laptop connected to home Wi-Fi while dozens of background applications compete for system resources.
Their indicators are identical.
Their execution isn’t.
Over time, small differences in order processing, platform responsiveness and connection stability can accumulate in ways that no additional indicator can compensate for.
Professional traders understand that improving execution often produces more consistent results than endlessly refining entry signals.
Finding an extra indicator rarely creates an edge.
Executing an existing strategy consistently often does.
Building a Cleaner Trading Process
Reducing the number of indicators doesn’t mean abandoning technical analysis.
It means becoming more intentional about the information each tool provides.
A useful exercise is to ask a simple question every time a new indicator is added to the chart:
What unique information does this give me that I don’t already have?
If the answer is unclear, the indicator probably isn’t improving the strategy.
Many successful traders organise their analysis around a small number of independent concepts instead of accumulating technical tools.
A typical workflow might include:
- identifying the broader market trend;
- assessing volatility;
- defining key support and resistance levels;
- measuring risk before entering the trade;
- executing the position consistently according to a predefined plan.
Notice what’s missing.
There’s no requirement for six oscillators to agree before taking action.
The objective isn’t to eliminate uncertainty — that isn’t possible in financial markets.
The objective is to build a decision-making process that remains consistent regardless of whether the previous trade was a winner or a loser.
Consistency — not complexity — is what allows a trading edge to reveal itself over hundreds of trades.
Final Thoughts
Every trader eventually discovers a difficult truth about technical analysis.
The market doesn’t become easier to understand because the chart becomes more complicated.
Most indicators are valuable when used for a specific purpose. Problems arise when they become substitutes for confidence rather than tools for analysis.
Adding another oscillator may feel like reducing uncertainty, but uncertainty is an unavoidable part of trading. No indicator can eliminate it.
The traders who achieve long-term consistency rarely do so by finding a secret combination of technical indicators.
They succeed because they build repeatable processes, manage risk objectively and execute their strategies with discipline.
In the end, profitable trading is less about finding more signals and more about trusting a well-tested system, maintaining consistent execution and avoiding unnecessary complexity.
The cleanest charts often belong to the traders who understand the market best. They know that success rarely comes from adding one more indicator—it comes from removing everything that doesn’t genuinely improve the quality of a decision.