With charts being the essence of informed trading, their importance is on another level for day traders. Flags, triangles, head and shoulders, and other patterns can be adjusted and analyzed as day trading graphs, helping enthusiasts make profits on a regular basis.
What is daily chart in stock markets and how to apply it properly? If you want to learn more about capitalization tactics on these graphs and what opportunities they deliver, off you go!
An Overview of Day Trading Charting
Technical analysis of price action throughout the day and making appropriate buy-and-sell decisions are what day trading charting boils down to. To minimize overnight risks, investors of any caliber close their positions before the market closes. The key is to analyze price graphs swiftly and effectively, monetizing on rapid fluctuations.
Any appropriate strategy is based on charts — they work as the primary source of information and hint at buy-and-sell orders of different risk levels. To benefit from this trading style, you are to pick up the best timeframe:
- If you want to maintain decision-making accuracy, ensure you don’t spice up the noise typical for daily graphs. Stay aside from charts framed by less than fifteen minutes, unless you are engaged in high-frequency trading.
- Don’t hesitate to apply additional algorithms to advance your proficiency in scalping. You can take your execution and concentration to the next level with top-tier trading algorithms and software, as well as multiple trading screen setups to analyze different indicators and compare charts, assets, etc. simultaneously.
The table below identifies the key features of the most common intraday trading tactics. Just check them out!
| Strategy |
Key Features |
Typical Timeframes |
Execution Style |
| Scalping |
Rapid trades for small price movements |
1-minute to 30-minute charts |
Fast entry and exit based on short-term price shifts |
| News Trading |
Trades based on global and economic news |
15-minute, 30-minute, 1-hour |
Reacts to real-time news for market volatility |
| Trend Trading |
Trades based on identified market trends |
15-minute, 30-minute |
Positions held until market trend changes |
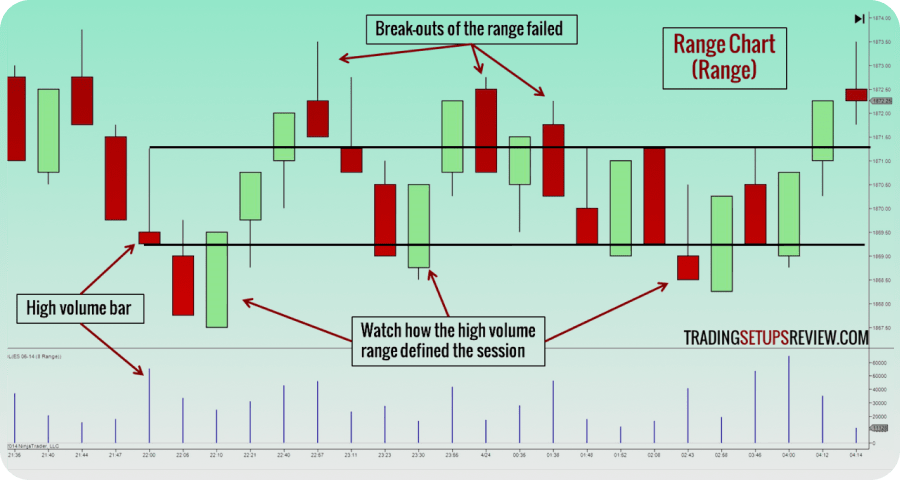
| Range Trading |
Profits from price oscillation within a range |
5-minute, 15-minute, 1-hour |
Entry and exit positions near support and resistance levels |
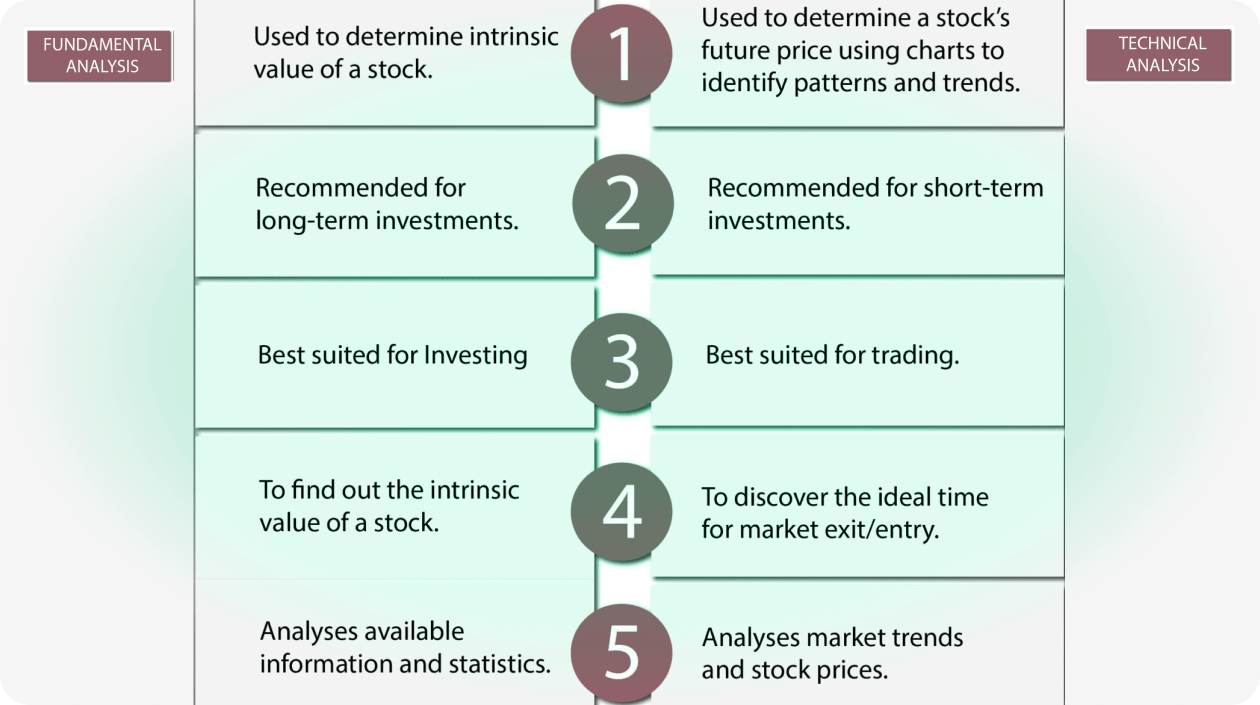
Key Differences: Day Trading Chart Analysis vs. Fundamental Analysis
Integrating different strategies and formats of data interpretation will increase the credibility of insights received from day trading graphs. While fundamental analysis and day trading chart analysis are different, both can help you minimize the risk of false signals and make buy-and-sell decisions with greater confidence.
| Aspect |
Day Trading Chart Analysis |
Fundamental Analysis |
| Timeframe |
Focused on short-term, intraday price movements |
Focused on long-term value and market fundamentals |
| Objective |
Capitalizing on rapid price changes within the same day |
Assessing the intrinsic value of a stock/company |
| Primary Tools |
Technical indicators (e.g., moving averages, RSI) |
Financial statements, economic indicators |
| Data Focus |
Price action, volume, candlestick patterns |
Earnings, revenue, cash flow, debt levels |
| Duration of Trades |
Minutes to hours |
Months to years |
| Market Behavior |
Relies on short-term price volatility and momentum |
Relies on long-term economic trends and stability |
| Risk Level |
Higher risk due to rapid market fluctuations |
Moderate risk, focused on long-term stability |
| Decision Drivers |
Technical signals, chart patterns, market sentiment |
Company fundamentals, industry performance |
| Investment Horizon |
Very short-term, day-to-day trading |
Long-term growth and value investing |
| Market Events Impact |
Sensitive to immediate market events and news |
Impacted by macroeconomic factors and company fundamentals |
| Strategy Complexity |
Fast-paced and requires quick decision-making |
Research-intensive and involves deep analysis |
| Common Users |
Day traders, high-frequency traders |
Long-term investors, value investors |
Instead of fundamental analysis, feel free to introduce more advantageous trading indicators in your performance tactics:
- Bollinger bands — this indicator helps you define whether taking a buy position is a great idea, given the current market state — selling the stock if its cost is over the upper Bollinger Band line and vice versa if it is below its lower line.
- Daily moving averages — confirm bearish and bullish market trends with the DMA parameter in your technical analysis. For example, a bullish tendency occurs when long-term averages lag behind short-term ones.
- Relative Strength Index — on a scale from 0 to 100, if this parameter reaches 70, it implies a selling recommendation. However, if it surpasses the rate a lot, it is an identification of an oversold scenario in the market. You can buy assets at a more advantageous price when the indicator falls to 30. If it reaches below 30, the overbought setting occurs.
A Step-by-Step Guide on How to Analyze Day Trading Charts
How does daily trend analytics work? Here is a plan to consider and natively implement the benefits of day charts in your strategy:
- Look for chart patterns first. Indicate prospective price movements, hidden behind head and shoulders, flags, wedges, and other formations.
- Utilize technical indicators, including MACD, MA, and RSI, to confirm your predictions and gauge market conditions in more detail.
- Observe the target stock’s price movement and distinguish its behavioral patterns — the likelihood of reversal, the current trend in the market, and more.
- Confirm the validity of the tracked chart pattern with volume monitoring.
- Define trade levels for the deal and set entry and exit points with risk management strategies in mind — a stop-loss order is a must.
- Spot breakdown or breakout signals by drawing and analyzing trend lines.
- Before trading, make sure to backtest your tactic. Review historical data, contributing to your decision’s accuracy with market news analysis.
Difficulties and Challenges of Day Trading Charting
To act like a pro and take the most out of trading daily chart effectiveness, you are to mitigate risks appropriately. Start by getting a deeper insight into what problems you might encounter in the market:
- Given the fast-paced intraday trading environment, predicting how exactly global news will impact the market is far from being as simple as ABC.
- Day trading requires more focus and attention to detail than alternative trading strategies, which are time-consuming and somewhat exhausting.
- The risk of impulsive “shopping” increases because of emotional stress caused by swift price fluctuations and the overall fast-paced nature of the day trading ecosystem.
- This approach requires deep knowledge of patterns, technical indicators, and other parameters to omit false signals and noise in intraday trading.
- Short timeframes tend to be highly volatile and may overload traders with excessive information, leading to less accurate decisions and financial losses.
A Summary of Different Types of Day Trading Charts
The main challenge of daily charts stocks in technical analysis is how unpredictable price fluctuations can be. To take control of your strategy and improve your understanding of market sentiment, it is important to customize the view of the asset’s price movement. Check the table below for a concise comparison of the key data representation formats in the market.
| Aspect |
Candlestick Charts |
Line Charts |
Bar Charts |
| Data Displayed |
Open, high, low, and closing prices |
Closing prices only |
The same range of data sets as in the case with candlestick charts |
| Detail |
High detail with all price points |
Limited to closing prices |
Highly detailed information overview with fluctuating price points included |
| Trend Visualization |
Detailed trends and reversals |
Smooth and clear long-term trend |
A closer look at reversals and trends on daily charts |
| Suitability |
Ideal for short-term trading and analysis |
Best for long-term trend analysis |
Functional for short-term technical analysis and trading |
| Complexity |
More complex with additional details to consider |
Simple and easy to read |
Moderate complexity, given the abundance of additional details on charts |
Candlestick Charts
Every candlestick presents open, high, low, and close price points for a day, which works for discovering unique and detail-forward insights into price action and market sentiment. With the candle and wicks to analyze (also known as a body and shadows), their sequences result in a wide range of formations:
- Bullish and bearing engulfing — a large candlestick engulfs intro the former candlestick, but the difference between uptrend and downtrend reversals lies in the switch of colors — from green to red and red to green, accordingly.
- Harami crosses — in a bullish setting, a doji follows a range of three or more down candles. In an uptrend scenario, equal open and close price points in a row lead to a doji.
Compared to other kinds, it is a frontrunner on the list. They are preferred by many beginners and seasoned experts for their impact and time value for strategic planning and technical analysis goals.
Bar Charts
This format of detailed representation of price movements has a bar as a core element, hence the name. Like in the case of candlestick charts, its structure is based on the high, low, closing, and opening prices of the target asset. The use of colored graphs will be a smart move, letting you grasp more details of price fluctuations on a day-to-day basis at a glance.
While this amount of data may be challenging to track, especially in high-frequency trading scenarios, this chart’s efficiency in pattern identification and assistance in making data-driven decisions isn’t under debate. Combined with Bollinger bands, moving averages, and other indicators, such a data visualization approach enhances trading strategies, leading to more precise entry and exit points.
Line Charts
Here is another approach to visualizing data on daily graphs:
- A line is a key component, minimizing clutter on price action configurations.
- It focuses on closing prices only, granting a smooth overview of the broader market direction and sentiment.
Although it allows for access to limited data series, it is still a great complementary technical analysis tool for short-term intraday trading across markets and various asset classes. As in the case with other kinds of charts, they will come in handy in the following scenarios:
- for identifying long-term trends;
- for analyzing the trend lines and determining resistance and support levels;
- for unique insights in the realm of multiple asset comparison, letting you overlay several line charts without creating unnecessary clutter;
- for confirming current trends, including potential entry and exit signals.
Essential Patterns in Day Trading Charts to Be Aware of
What is the best chart for day trading? Here are time-tested patterns for valuable insights into market sentiment and the target stock’s movement behavior.
Trend Reversals
Such patterns showcase their power when traders manage to enter and exit positions with the maximum accuracy possible. Triple tops and bottoms, head and shoulders, and Sushi Rolls are a few examples of successful intraday trading patterns.
| Aspect |
Pros |
Importance |
Use for Different Strategies |
| Early Entry |
Captures reversals before major moves |
Allows traders to maximize profits |
Used by scalpers to enter trades quickly |
| Risk Management |
Identifies potential exit points |
Helps minimize losses |
Essential for swing traders to limit downside risk |
| Confirmation of Signals |
Validates technical indicators |
Confirms entry/exit timing |
Relied on by momentum traders to confirm price direction |
| Volatility Prediction |
Anticipates market volatility shifts |
Informs better trading decisions |
Crucial for trend traders to avoid false signals in volatile markets |
Breakouts
While such patterns tend to provide clear entry and exit price points, it is essential to set stop-loss orders — set them below support or above the resistance level, depending on the configuration. You can confirm a trend continuation by watching for volume in the setting.
| Aspect |
Benefits |
How to Use |
How to Determine |
| Profit Potential |
Captures strong price movements early |
Enter trades when the price breaks above/below key levels |
Use support/resistance levels, volume spikes |
| Momentum Trading |
Leverages increased volatility for quick gains |
Combine with technical indicators (RSI, MACD) for confirmation |
Look for consolidations followed by sharp price moves |
Shooting Star
It forms when the price of an asset rises considerably but fails to keep up with the move and closes near the opening price. Effective for short positions, it occurs at an uptrend’s top. It is considered to be a bearish chart formation in the market. Onwards!
| Aspect |
Peculiarities |
Applications in Daily Trading |
| Formation |
Small body, long upper wick, and little/no lower wick |
Signals potential bearish reversal after an uptrend |
| Market Sentiment |
Indicates rejection of higher prices |
Used to identify overbought conditions |
| Confirmation |
Requires follow-up with a bearish candle for validation |
Confirm trend reversal before executing trades |
| Risk Management |
Risk of false signals in strong bullish markets |
Place stop-loss above the wick to limit potential losses |
Doji Candle
This kind of pattern is a pretty accurate indicator of a trend reversal. When you spot it near the end of a current trend, it helps you profit at nearby resistance and support levels. The use of Fibonacci retracement for targets is also welcome.
| Aspect |
Main Features |
Efficiency |
Strategies for Day Traders |
| Formation |
A candlestick with a small or non-existent body, where the opening and closing prices are nearly identical |
Signals indecision in the market, often a reversal indicator |
Enter trades when a Doji appears after a strong trend, signaling a potential reversal |
| Market Sentiment |
Reflects market indecision between buyers and sellers, suggesting a pause in the trend |
Efficient when combined with other patterns or indicators for confirmation |
Use support/resistance levels or other patterns for better confirmation |
Bullish Engulfing Pattern
This configuration is used to indicate a potential uptrend. Traders appreciate it for its high accuracy in signaling bullish reversals — check near support levels for greater accuracy and stronger signals.
| Aspect |
Main Features |
Efficiency |
Strategies for Day Traders |
| Formation |
A small bearish candle is followed by a large bullish candle that completely engulfs the previous one |
High in reversing short-term downtrends |
Enter long after the bullish candle closes, confirming the reversal momentum |
| Timeframe |
Can be spotted on 5-min to 1-hour charts in intraday trading |
High for short-term trades and quick reversals |
Use smaller timeframes to find early entries for quick profits |
| Confirmation |
Needs volume confirmation for greater accuracy and reliability |
Efficient with additional technical indicators |
Combine with RSI or moving averages to validate the reversal moment |
Bull Flag
It is a good continuation trend with high accuracy. You will likely spot it in stocks with strong uptrends.
| Aspect |
Main Features |
Efficiency |
Strategies for Day Traders |
| Formation |
A short-term downward consolidation (flag) following a sharp upward move (flagpole) |
High efficiency in trending markets |
Enter after the breakout above the flag’s resistance level |
| Trend Continuation |
Bull flags indicate a continuation of an existing uptrend |
High-end accuracy |
Use stop-loss below the flag to minimize risks |
| Breakout Trigger |
Occurs when the price breaks above the upper trendline of the flag |
High accuracy in strong bullish markets |
Combine with volume spikes to confirm the breakout |
| Timeframe |
Usually seen on short-term charts (e.g., 15-min, 30-min, 1-hour) |
Efficient for day trading when combined with volume analysis |
Use smaller timeframes to catch early breakout signals |
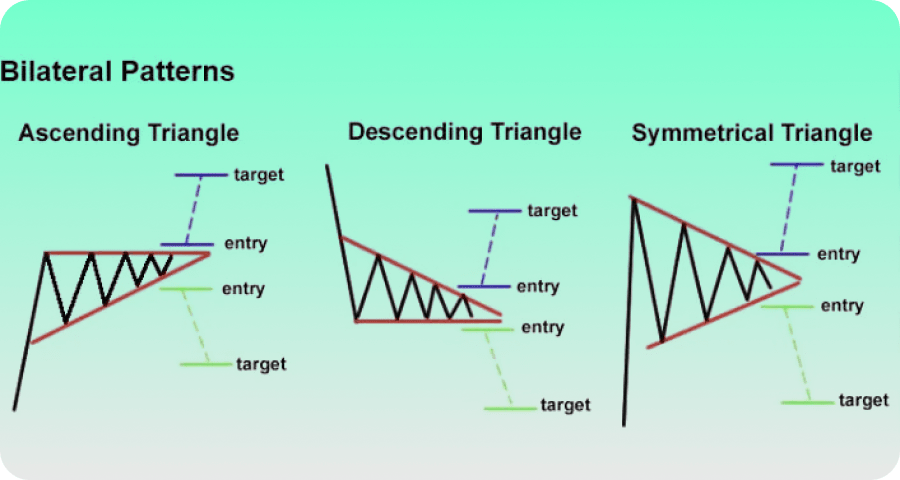
Ascending Triangle
Make sure to define this pattern correctly:
- The price’s breakout movement is directed upwards against the horizontal line.
- Unlike rising wedges, this pattern comes with a minimum volume.
Check the table below for more!
| Aspect |
Benefits |
How to Use |
How to Determine |
| Profit Potential |
Indicates potential bullish breakout |
Enter long positions after the price breaks above the resistance |
Identify flat resistance line and ascending trendline |
| Risk Management |
Clear breakout levels for entry/exit points |
Set stop-loss below the ascending trendline |
Confirm breakout with increasing volume |
| Trend Continuation |
Suggests the continuation of an existing uptrend |
Use it with momentum indicators for confirmation |
Look for multiple touches on resistance and trendline |
Additional Chart Patterns to Consider for Day Traders
With myriads of day stock chart patterns, keep on learning more about their variety and how diversification tools can assist you in achieving greater results based on in-depth data insights for well-informed decisions. Here are some options to bear in mind and test first:
- Descending triangles — this pattern is known for its bearish nature, featuring a descending upper resistance line and a flat lower support. It will come in handy to determine shorting opportunities with clearer signals for an upcoming downward breakout.
- Cup and handle — as the name implies, it comes with a small handle-like consolidation and a U-silhouetted cup to indicate a bullish trend continuation. Traders can use it for the sake of clear entry points when the handle breakout takes place.
- Standard and inverse head and shoulders — the traditional pattern comes with two small peaks (aka shoulders) and a large middle one (head), while the reverse version features three troughs of the same design. The first layout is for spotting trend reversals following uptrends, while the alternative configuration is for indicating a bullish reversal.
- Symmetrical triangles — compared to other triangles, this pattern is ideal for trading breakout strategies. Depending on confirmation through other indicators, it can indicate a continuation of the previous trend or its complete reversal.
- Rising and falling wedges — ascending and descending wedges are bearish and bullish patterns, correspondingly. In this case, traders can use a downward-sloping converging pattern to determine trend reversals in downtrends.
Key Takeaways About Mastering Day Trading Charts
To keep up with the expertise requirements for the right use of Forex trading daily charts, start by understanding the basics of a well-balanced and effective trading strategy. Distinguish between the most common and accurate patterns in the market, especially those applicable to intraday trading scenarios highlighted in this guide. With OBV, RSI, MACD, and MAL indicators, it is possible to prepare the best performance tactics for the ever-changing daily trading environment.