When combined with other technical analysis tools, a wide range of charts can help you define what direction the market has taken for its development trajectory this time. Checking candlestick patterns in stocks’ price movements is the most common method for anticipating trends and developing tailored trading strategies.
From this perspective, doji candles shouldn’t be underestimated as an informative instrument in unveiling the market sentiment and other unique behaviors. One of the key characteristics it has is its short length, implying a relatively narrow trading spectrum. In turn, this suggests that the opening and closing prices of the target stock have little deviations or are identical. While it is possible to view such charts as simply plus-like signs, there is more to them.
In this guide, we will walk you through the crucial aspects of doji candlesticks and why they will come in handy in multiple trading approaches. Off we go!
Understanding the Doji Candlestick Pattern
What is doji? The term “Doji” originates from the Japanese word meaning “error.” This name reflects the rarity of a situation where an asset’s opening and closing prices are nearly identical, creating a unique and descriptive label for this phenomenon.
| Aspect |
Details |
| Significance |
Represents market indecision and balance between buyers and sellers |
| Formation |
Occurs when an asset’s price fluctuates during the session but closes near its opening price |
| Key Types |
Standard Doji, Long-Legged Doji, Gravestone Doji, Dragonfly Doji, and Four-Price Doji |
| Interpretation |
Often signals a potential reversal or continuation depending on the trend context |
| Application in Analysis |
Used to identify market sentiment shifts in currencies, stocks, futures, and bonds |
A candlestick doji implies that the price doesn’t change since investors are gaining momentum before changing or continuing the current trend. Its appearance is non-existent, compared to other structures, given how its open and low prices visually merge and create the same line on charts.
| Aspect |
Details |
| Visual Appearance |
A candlestick with little to no body, often accompanied by varying shadow (wick) lengths |
| Implications |
Signals market indecision, possible trend reversal, or continuation depending on the surrounding trend |
| Usage |
Can appear in any time frame or interval, providing insights into price behavior across different assets |
Here is what doji patterns can indicate in trading:
- Market indecision — it’s as simple as it sounds: the selling and buying pressure is in the rare status quo.
- Pattern confirmation — although you will need other technical patterns and tools for this goal, it is possible to confirm and enhance the signals of current trends in the market with the help of doji.
- Prospective breakouts — after periods of consolidation, such charts are capable of preceding drastic movements of the stock’s price.
- Loss of momentum — it may be explained as an indicator of the current trend’s “failing” moment when its strength gradually goes down.
- Resistance and support testing — you will be able to define key price levels and if there is hesitation between them.
- Trend continuation — in certain instances, the doji aftermath leads to the ongoing trend’s continuation.
- Trend reversal — this moment of identical pressure between buyers and sellers may showcase the change in their powers and a new trend’s start, be it bearish or bullish.
Formation of the Doji Candlestick: Key Insights
A candle doji formation boils down to the following stages:
- Price movement — a stock’s price fluctuates and changes its direction during the target trading frame.
- Opening and closing prices — when buyers and sellers don’t overpower each other, these parameters tend to coincide or be extremely similar, hence the occurrence of the doji candlestick on the chart.
- Body formation — in turn, the body of the candlestick becomes barely visible and seems like a simple line. Depending on the price ratio and primary market sentiment, the horizontal line’s (professionally defined as wicks or shadows) position against the vertical bar will vary a lot — a doji can remind you of a cross, for instance.
- Time frame — doji patterns can form at any moment, including one-minute intervals and daily charts or longer frames.
On the other hand, you are to be aware of possible doji limitations to improve your strategic planning in trading. Compared to other indicators, it is pretty neutral and doesn’t offer a wide range of insights. Its rarity does make it less appealing in the eyes of traders, but it has to be included in your suite to be up in arms for as many trading scenarios as possible. Check the table below to check the key drawbacks of overly focusing on doji patterns.
| Aspect |
Limitation |
| Context-Dependence |
Doji patterns require analysis of the surrounding trend and cannot provide standalone signals. |
| Ambiguity |
It may indicate either a trend reversal or continuation, leading to potential misinterpretation. |
| False Signals |
In volatile or low-volume markets, foji patterns can produce unreliable or misleading signals. |
| Limited Predictive Power |
This often needs confirmation from subsequent candlesticks or patterns for actionable trading decisions. |
| Overemphasis |
Over-reliance on doji patterns may cause traders to ignore other critical technical indicators. |
| Lack of Direction |
It does not indicate the magnitude or direction of the next price movement without additional context. |
The Importance of Doji Colors in Trading Decisions
Although the closing and opening prices of the asset are so identical, it doesn’t mean you can afford to underestimate what hints of information the chart’s colors can provide you with. Adjust your chart to ensure the high-end efficiency of your technical analysis.
| Aspect |
Details |
| Doji Color Significance |
A doji candlestick’s tint showcases whether it’s hollow (bullish) or filled (bearish). |
| Interpretation |
The color helps traders understand the market sentiment during the formation of the doji. A filled doji might imply that the price closed lower than it opened, while a hollow doji suggests the opposite. |
| Context Dependency |
The color’s importance is heightened when considered alongside the overall market trend and other indicators. |
| Trend Confirmation |
A foji’s color, in combination with prior trends, can confirm either a continuation or reversal of market direction. |
Paying no attention to the doji’s color will be a huge mistake:
- You may easily misunderstand the market’s sentiment and miss out on the moment when the seller or buyer dominance momentum is going to start.
- You may enter poorly thought-after trades based on wrong assumptions and experience financial losses.
- You miss out on essential contextual details of the overall analysis. In turn, failing to determine bullish or bearish signals in the market may add unnecessary risks and make your strategy less functional.
- Ignoring what doji color is on the chart may result in trades completed against the prevailing market direction.
Interpreting the Red Doji: Signals and Implications
When it comes to defining the types of doji, the way its body is formed makes a difference. In this case, you deal with the security’s price action, where the opening price is slightly higher than the closing one. On the chart, the order of pieces of data from top to bottom will be as follows — high, open, close, and low.
| Aspect |
Details |
| Red Doji |
A doji, where the closing price is lower than the opening price, is typically filled (solid). |
| Market Sentiment |
This indicates a bearish market sentiment. It suggests selling pressure and a potential market downturn. |
| Signals |
It showcases a potential trend reversal from a bullish trend to a bearish one. You will view indecision in the market as both buyers and sellers are in balance. |
| Implications |
It may signal a weakening trend, especially when occurring after an uptrend. This also suggests the potential for further downward movement if confirmed by other indicators. |
| Trader Action |
Consider selling or shorting positions. Wait for confirmation with subsequent candlesticks or indicators before acting. |
| Limitations |
It can sometimes provide false signals if not analyzed in the context of previous price action. |
Insights from a Green Doji: Market Sentiments
You can effortlessly portray this bullish doji after understanding its key components — high, close, open, and low prices follow each other when you analyze the structure from the top to the bottom. As in the case of red-bodied layouts, the green doji meaning is all about the one-minute difference between the opening and closing price of the target security.
| Aspect |
Details |
| Green Doji |
A doji, where the closing price is higher than the opening price, is typically hollow (empty). |
| Market Sentiment |
This indicates bullish market sentiment. It suggests buying pressure and a potential market uptrend. |
| Signals |
It implies a potential trend reversal from a bearish trend to a bullish one. |
| Implications |
This may signal a strengthening trend, especially when occurring after a downtrend. It also suggests the potential for further upward movement if confirmed by other technical indicators in the market. |
| Trader Action |
Consider buying or going long, of course, paying attention to pieces of data acquired through additional technical indicators in your suite and subsequent candlesticks — everything to confirm your decision’s efficiency. |
| Limitations |
It may lead to false signals and, therefore, poorly executed trades, financial losses, and missed “winning” opportunities in the market. |
Exploring the Various Types of Doji Candlestick Patterns
Taking a deeper insight into doji types is a nice move to spot early warning signs about trend continuation or reversal. That’s how you anticipate such changes before they actually happen and act accordingly. At the same time, this pattern will contribute to the quality, transparency, and case-appropriateness of your technical analysis, letting you adapt to market cycles with ease.
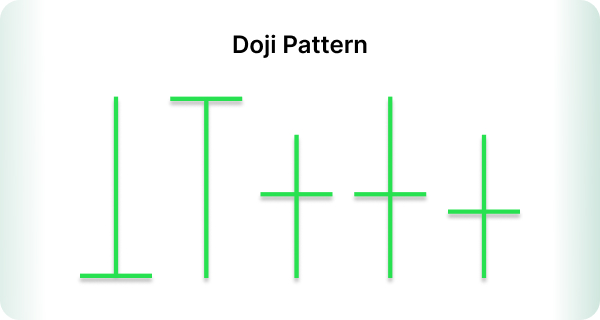
Classic Doji
A standard type alone won’t function as a doji reversal indicator and so on. It is crucial to analyze its characteristics amidst other parameters, including the volume. The layout is depicted in the following manner:
- a non-existent body, namely, a horizontal line on the chart;
- short upper and lower shadows.
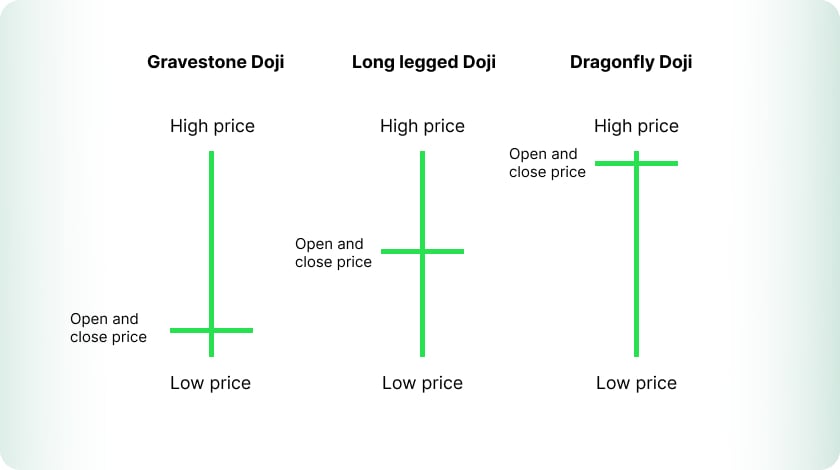
Long-Legged Doji
This candlestick chart doji will work for those who are interested in anticipating a perspective shift in the ongoing trend’s direction, especially when it takes place after a drastic price movement. As a trend reversal indicator, a long-legged doji will be effective during strong bearing and bullish momentums. It is especially true for cases when the analyzed pattern is determined and located at the end of a current bullish trend — there is a high chance for the upcoming switch as the security price starts to decline.
As for the structure, it is a happy medium between the gravestone and dragonfly doji patterns discussed below — its horizontal line is a central focal point of the construction, with upper and lower shadows both being long. It is also what differentiates this type from a classic doji.
Gravestone Doji
This type of doji chart can be identified by its unique design. It comes with an almost absent lower shadow and a way longer upper wick/ The position of the horizontal line is what distinguishes this candlestick from others — low, open, and close are located near each other.
| Aspect |
Details |
| Pattern Structure |
The opening price, closing price, and lowest price are close or coincide. The highest price is much higher, forming a long upper shadow. |
| Market Sentiment |
It indicates bearish dominance but may also signal a prospective reversal of the ongoing trend. |
| Signals |
It denotes a probable negative trend reversal following an upswing — the loss of positive momentum, with purchasers surrendering their profits to sellers at the end of the period. |
| Implications |
It can be seen as a warning sign for a market downturn. It also often marks the end of an uptrend. |
| Trader Action |
Consider shorting positions or selling after confirmation of the pattern with additional indicators. |
Dragonfly Doji
This scenario is a reversal of how gravestone doji charts are depicted. Instead of non-existent low shadows, the upper one takes this role here. The horizontal line is relocated to the top of the layout.
| Aspect |
Details |
| Pattern Structure |
The opening, closing, and high prices are close to each other, while the low price is much lower, forming a long lower shadow. |
| Market Sentiment |
It defines bullish dominance and signals a prospective reversal of the trend, which may end up becoming a bullish one. |
| Signals |
Potential bullish trend reversal after a downtrend. Strong buying pressure with buyers overcoming sellers. |
| Implications |
Here is a sign of high demand in the market and the failure of bears to push prices lower. It typically marks the end of a downtrend. |
| Trader Action |
Opening long doji trading positions or buying the target stock may be a profitable choice in this case. |
Hammer Doji
This doji trading pattern belongs to the category of candlestick patterns that imply bullish reversal moments in the market. The horizontal line is located at the top of the layout. In most cases, the price goes higher after this candlestick is spotted, so its efficiency is pretty high — in three out of four cases. It is formed when the price fell during the previous trading day and didn’t start strong during the next one. To unblur your vision on how to trade with hammer doji candlestick patterns, feel free to practice your strategy in your demo account or check more historical data for greater confidence.
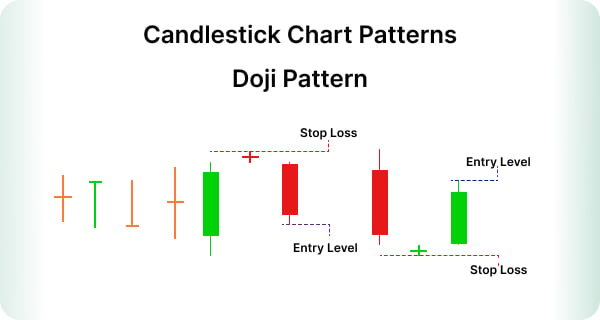
Bearish Doji Star
The number of bearish doji star occurrences isn’t impressive — it may easily be 0.5% out of all candlestick patterns. Unlike other types in this classification, this layout includes two candles:
- a white body that follows a stick in an uptrend;
- a doji of any caliber (the four-price kind is an exception), located above the first candle.
Here are a few examples of how bearish doji stars can be interpreted given the trading environment.
| Aspect |
Details |
| In a Bullish Trend |
If you spot them when an uptrend comes to its final stage, the bullish momentum is highly likely to fade away. In other words, you are witnessing the symptoms of the market’s weariness and a potential change in the current trend. Investors should watch for a follow-up bearish candle. |
| In a Sideways Market |
In a consolidating or range-bound market, the bearish doji star could indicate the end of a temporary rally, as the doji signals indecision, followed by a bearish movement. This pattern suggests that the market may continue its consolidation. |
| In a Bearish Trend |
The pattern appearing in the middle of a downtrend often signals a pause or retracement before the trend resumes. While it may offer a short-term bounce, the overall bearish trend is likely to continue unless confirmed by other indicators. |
| Volume Considerations |
A higher volume during the bearish candle confirms the strength of the reversal. If the volume is lower, the reversal may be weaker, and the trend may pause or continue rather than fully reverse. |
Four Price Doji
The 4 price doji defines a unique price motion without any fluctuations during the trading day. In turn, all the crucial parameters on the chart are equal. Traditionally for doji patterns, it also represents market stagnation or indecision. The nuanced meaning is in its depiction of a temporary consolidation in the upward rise during the bullish trend. In the opposite scenario, the distinguished kind of doji in a bearish environment is for a selling pressure’s slowdown.
When it relates to overextended bearish or bullish trends, it may function as a reversal indicator. However, it has to be confirmed by other technical analysis means.
Final Thoughts
The asset’s price correctly represents all the relevant data about its development path, indicating its overall efficiency in the eyes of sellers and buyers. Nonetheless, historical performances can’t serve as a warrant for future success — a stock’s current price may acquire an intrinsic value and get a little bearish. In turn, using doji candlestick patterns, among other techniques, is necessary to cut through the market noise and define the best trades for your strategy.
While understanding the doji candlestick meaning alone won’t get you to a multi-potent trading strategy, it will become a great instrument for locating and determining market trends. Despite its rarity, this pattern may be misleading and ruin your trading deals if you underestimate its potential.