Breakout in trading is among the most top-notch practices for active investors. It is highly scalable, adaptable, and appropriate for multiple timeframes, letting professionals take profits from major moves in assets’ prices. In this guide, let’s define the nuances and hidden pitfalls of this strategy and see how advantageous it can be in the right hands. Onwards!
What to Know About Breakout Strategy in Trading
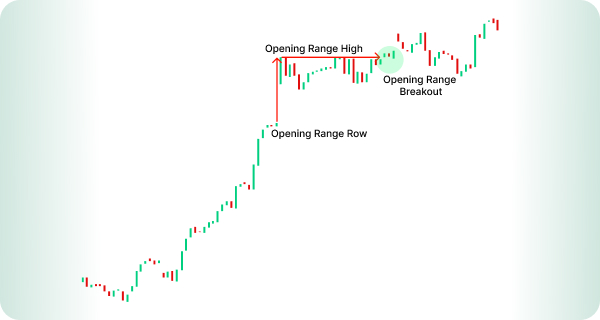
Overall, trading breakouts are the moments when an asset’s price crosses either resistance or support levels after some time of being within the trading range but fluctuating, indicating prospective reversals. The stock breakout meaning doesn’t only lie in presenting money-earning opportunities for traders but also in confirming the volume and validating the current trend.
The best use for breakout strategies comes with strong momentum in the Forex or stock market — for maximum profits. Of course, don’t forget to double-check indicators like MACD and RSI to validate the expected behavior of the target asset’s price motion.

How Breakouts Work in Stock and Forex Markets: Valuable Insights
Stock breakouts signify the moment an asset’s price surpasses the level of resistance or support and goes in the opposite direction — up or down. These levels commonly serve as transparent signals for stop-loss orders and entry/exit points. Analyze the table below to define what key parameters signal breakouts across markets and what measures are to be utilized to refine and verify the right breakout trading strategy for investors.
| Market Type |
Parameters Defined |
Connection with Technical Indicators |
| Stock Market |
- Support and resistance levels
- Trendlines and chart patterns (e.g., triangles, channels)
- Key price levels (e.g., highs, lows)
- Breakout direction (up or down)
|
- Moving Averages (MA) — breakouts above or below moving averages signal trend shifts
- Volume — a breakout confirmed by volume increases suggests strong momentum
- Relative Strength Index (RSI) — overbought/oversold conditions help validate breakouts
- Bollinger Bands — breakouts outside the bands often indicate strong price movements
|
| Forex Market |
- Support and resistance zones (horizontal levels)
- Economic and geopolitical events affecting price levels
- Currency pairs’ price action patterns
- Price action around round numbers and psychological levels
|
- Fibonacci Retracement — potential breakout levels following the key Fibonacci ratios and principles
- Moving Average Convergence Divergence (MACD) — potential breakout points based on crossovers on charts
- Stochastic Oscillator — for determining overbought/oversold conditions in the strategy
- Average True Range (ATR) — this measures market volatility to help set appropriate breakout targets
|
| Both Markets |
- Timing of breakout (during key trading hours)
- Momentum and volatility during the breakout
|
- Price Action — observing candlestick patterns like engulfing or doji candles helps confirm breakouts
- Parabolic SAR — signals potential trend reversals after a breakout, adding confirmation
|
Types of Breakout Strategies to Choose for Different Markets
The best thing about utilizing breakout trading tactics is that they don’t depend on the timeframe. You will find them effective across markets as universal concepts for weekly, daily, or even intraday charts. Whatever type of strategy to rely on, the first task is to define the levels of support and resistance within the configuration. The more interactions the price movement trajectory gains with either of them, the more crucial the related insights are. It potentially leads to more powerful breakout moments.
Diversify your palette of trading instruments by checking how popular patterns on charts alter in terms of the asset’s price movement when it comes to either support or resistance breakouts. Take a look at the table below.
| Aspect |
Pattern Breakouts |
Support/Resistance Breakouts |
| Definition |
It occurs when the price moves out of chart patterns like triangles, flags, or head-and-shoulders. |
This happens when the price breaks a well-established support or resistance level. |
| Types |
- Triangle — symmetrical, ascending, or descending
- Flag & Pennant — continuation patterns
- Head-and-Shoulders — reversal pattern
- Wedges — rising or falling
|
- Support Breakout — the price falls below a support level.
- Resistance Breakout — the price moves above a resistance level.
|
| Indicators Used |
Pattern structure, volume confirmation, and trendlines |
Price levels, candlestick signals, and volume analysis |
| Timeframe Suitability |
Best suited for mid- to long-term trading setups |
Effective for short- to medium-term strategies |
| Entry Points |
Enter upon breakout of pattern boundaries, often confirmed by volume spikes. |
Enter when the price decisively breaks support or resistance, with confirmation through retest or momentum. |
| Risk Management |
Stop-loss placed outside the pattern boundary to avoid whipsaws |
Stop-loss placed slightly above/below the broken level to minimize false breakout losses |
| Market Conditions |
Effective in trending or consolidating markets |
Works well in range-bound or breakout-driven markets |
| Advantages |
Provides visual clarity for decision-making
Accounts for price patterns and trader psychology |
Simple and widely applicable
Easy identification of levels on most charts |
| Challenges |
- Requires precise pattern recognition skills
- False breakouts are common in volatile markets
|
- This may result in frequent stop-outs in choppy markets
- Dependent on confirmation to reduce risk
|
You are to carefully plan your entries and exits to take the most out of Forex breakout strategies. Instead of aiming at maximum profits and taking larger risks, determine a reasonable objective given the target circumstances on the chart — resistance and support levels, trading volume, the asset’s price pattern, and more. It won’t be extra to adapt your practices to the target market type and balance its features with tailored breakout trading tactics.
| Market Type |
Breakout Strategy |
Key Features |
Why It Works |
| Trending Markets |
Momentum Breakout |
Capitalize on rapid price movements caused by high demand or news. |
Leverages volatility for quick profits; ideal for active traders |
| Range-Bound Markets |
Channel Breakout |
Identify breakout points from established support and resistance levels. |
Offers clear entry and exit points; reduces uncertainty |
| Emerging Markets |
Volume-Based Breakout |
Focus on unusual volume spikes as indicators of market activity. |
Early entry into potentially high-growth opportunities |
| Volatile Markets |
Volatility Breakout |
Use Bollinger Bands or ATR (Average True Range) to gauge breakout potential. |
Ensures trades align with the market’s natural fluctuations |
| Established Markets |
Breakout Retest |
Enter after a breakout level is retested, confirming the breakout’s strength. |
Reduces false breakout risks; offers higher confidence in entry points |
| Sector-Specific Markets |
News-Driven Breakout |
React to sector-specific events, like earnings reports or policy changes. |
Aligns trading strategies with impactful, sector-relevant information |
| Forex Markets |
Time-Zone Breakout |
Focus on breakouts during active trading hours (e.g., London or New York session overlaps). |
Exploits high liquidity and volatility during key market hours |
| Commodity Markets |
Fundamental Data Breakout |
Base decisions on inventory reports, weather patterns, or geopolitical tensions. |
Combines technical triggers with fundamental insights for more robust strategies |
Effective Trading with the Use of Breakouts in Forex
Whatever trade breakout strategy you employ, it is crucial to ensure the price movement won’t lead to a so-called fakeout:
- Wait for confirmation — you are to utilize additional technical analysis indicators to observe and verify the consistent nature of the stock’s movement outside of the typical trading range. It will also help you minimize the risks of biased and impulsive trading decisions.
- Understand fakeouts — take your time to track how fakeouts can act on charts. The key difference from an actual breakout is that it returns to the previous trading range. That’s why it is recommended to avoid acting too early when the price keeps “bouncing” between support and resistance levels.
- Track volume — don’t underestimate the insights provided by this parameter. The rule of thumb tells us that a fakeout may be signaled by low volume during the period, while high trading volume is a factor supporting an upcoming breakout.
- Consider price sustenance — a legitimate breakout should be defined by stronger indicators like sustained levels of the price, where the latter holds at the breakout moment.
Systematize your approach in utilizing resistance and support breakouts. This way, you will improve the success rates of your deals and manage risks with greater efficiency in mind.
| Technique |
Details |
Tips for Traders |
| Identify Key Levels |
Mark critical support, resistance, or trendline zones using historical price data. |
Use higher timeframes for stronger, more reliable levels. |
| Set Alerts |
Use trading platforms to notify you when the price approaches key breakout levels. |
Avoid constantly watching charts; automate alerts to save time. |
| Analyze Market Context |
Assess the trend or consolidation phase to determine breakout likelihood and direction. |
Breakouts are more reliable during strong trends or after prolonged consolidations. |
| Wait for Confirmation |
Confirm the breakout with a candle closing outside the key level or increased trading volume. |
Avoid entering positions during the breakout’s initial surge to reduce false entries. |
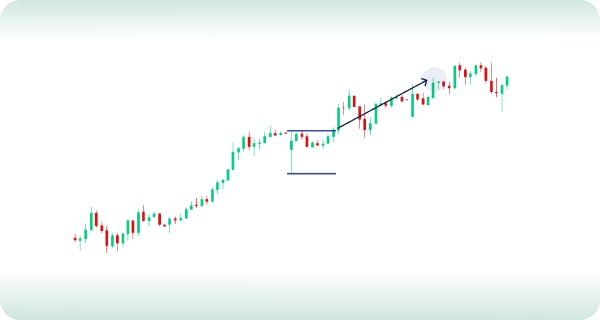
| Check for Retests |
Look for an asset’s price to retest the broken level, turning resistance into support (or vice versa). |
Use retests as safer entry points to improve reward-to-risk ratios. |
| Leverage Multi-Timeframe Analysis |
Validate breakout signals across different timeframes for reliability and context. |
Confirm with higher timeframes and execute trades on shorter ones. |
| Use Stop-Loss Orders |
Place stop-loss orders just beyond the breakout level or recent swing highs/lows. |
Protect your capital by setting stops based on volatility and risk appetite. |
| Set Realistic Targets |
Define profit targets based on breakout pattern projections or measured moves. |
Use Fibonacci extensions, previous highs/lows, or round numbers as exit points. |
| Adjust Position Sizing |
Allocate risk proportionate to the breakout’s strength and market volatility. |
Scale positions based on confidence levels and trading plan objectives. |
| Review and Adapt |
Analyze post-trade performance to identify successes or mistakes in breakout strategies. |
Keep a trading journal to refine your breakout techniques. |
Breakout Trading Strategies Summary: Pros and Cons
In the best-case scenario, you are to personalize implementing stock breakouts in your performance style, given your portfolio, technical analysis instruments, and level of proficiency. That’s how you mitigate trading-related risks in the target market and take the most out of occurring breakout trading opportunities.
| Experience Level |
Market Type |
Benefits |
Drawbacks |
| Beginner |
Forex |
- Clear entry/exit signals
- Easy to spot breakout levels
- High liquidity and tight spreads improve trade execution.
|
- High risk of false breakouts without confirmation
- Overtrading due to excitement, leading to losses
|
| Intermediate |
Stock Market |
- High potential for profit from strong trending moves
- Supports better trend-following strategies
|
- May miss some breakouts if waiting for confirmation
- Requires advanced risk management techniques
|
| Advanced |
Commodities/Indices |
- Enhanced risk/reward ratios with precise setups
- Ability to use advanced indicators (e.g., volume analysis)
|
- Can be difficult to identify reliable breakouts in volatile markets
- Potential for significant losses in fast-moving markets
|
| All Levels |
Cryptocurrency |
- Provides opportunities in volatile, high-momentum markets
- Can capitalize on fast price movements
|
- Market unpredictability can lead to unexpected reversals
- Requires quick decision-making, which may not suit all traders
|
| All Levels |
Global Markets |
- Breakouts often signal strong market momentum and trends
|
- Over-reliance on breakouts can ignore market fundamentals
|
Final Thoughts
The trading breakout strategy stands out with high potential profit while providing you with clear entry and exit points. It is one of the easiest tactics to test and commonly comes in handy to define and confirm the start of a new trend in the market. With its high-end versatility and scalability, traders can enter both long-term and short-term positions and adjust them to any timeframe. While you are to be cautious of market noise and sentiment to prevent or minimize losses, profitable breakouts can change your view on trading activities in the Forex or another market.