There are plenty of risk-reward opportunities in crypto and fiat asset trading. To achieve the desired outcome, interested parties have to create their custom arsenal of financial tools and make data-driven decisions on their base. The head and shoulder pattern example is one of the most prominent formations to take into consideration.
Regardless of your expertise, this structural element of a price move won’t be Mission Impossible to handle. Keep on reading this guide to get a deeper insight into the nature of the head and shoulders candle pattern phenomenon and its effect on your trading strategy.
Unleashing the Power of Head Shoulders Patterns
On average, the efficiency of market predictions made with the distinguished pattern in mind is high. The exact percentage you may see on the internet is quite subjective — the overall statistical background to estimate its metrics is incomplete because of the lack of research.
Nevertheless, it doesn’t prevent enthusiasts from taking the most out of its potential. What does a head and shoulders pattern mean? Now is the right time to explore.
Analyzing the Characteristics and Structure of Head Shoulders Charts
The head and shoulders chart definition is as follows:
- This term defines a special visual form of a price move on the graph, which predetermines a significant bearish or bullish moment.
- There are two dominant types of head and shoulders patterns — for depicting uptrends and downtrends, accordingly.
The pattern’s silhouette resembles a head and left and right shoulders, hence the name. Traders also wonder — what does a head and shoulders pattern look like? People also distinguish classic and inverse formats due to the unique shapes of the two — M-shaped and W-shaped formations with a baseline and three lows or peaks for bearing and bulling trends, respectively.
The Key Fundamentals Behind a Head-and-Shoulders Pattern
What is a head and shoulders pattern for stocks? Its three obligatory structural components boil down to:
- Head — it is the top peak among the three ones in the chart. It is the central element of the big picture. Please note it will define the lowest decline in the case of an inverse pattern.
- Shoulders — they are rarely the same in their increase or decline, but the common difference between them is relatively small — easily 3%, give or take.
- Neckline — an imaginary connection between two shoulders is what lets interested parties define the break of the market sentiment.
To define “How reliable is a head and shoulders pattern?”, it is crucial to narrow down the palette of objectives you might set, as well as the current in-market situation, price volatility, volume, and so on. In terms of the likelihood the signal won’t be false, you have a wonderful chance to keep peace of mind and be satisfied with your initial forecast.
Inverse Head and Shoulder Pattern in a Nutshell
A head and shoulders chart formation results in a reversal of a downtrend and its steady growth to new highs on the graph. With three troughs in a row, the middle one displays the steepest decline. In this case, the breakout point comes through the resistance line and invites third parties to wait for the further upward tendency.
What You Should Know About Inverse Head and Shoulder Patterns
The inverse head and shoulders chart pattern meaning lies in forecasting a significant bulling trend in the market. Its formation starts at the culmination of the bearish trend. It is a reversal from a downtrend that goes on as a modest rebound of the ever-increasing price movement. In terms of technical analysis head and shoulders pattern complexity, the volume of the trend is pretty large and leaves room for adjusting the trading prediction.
How to Spot and Identify an Inverse Stock Head and Shoulder Pattern
The secret behind understanding how to recognize head and shoulders candlestick patterns and their inverse alternatives is straightforward. All you need to get started is to take a closer look at several images of the chart and locate the start and the end of the trend:
- a decline in the asset’s price and a relatively short-term increase for the left shoulder;
- the lowest “peak” for a price drop, making the structural head of a head and shoulders reversal pattern;
- a short-term increase, preceding the significant decline in the price movement and forming the pattern’s right bottom — namely, the right shoulder.
Here is how you can also recognize the analyzed pattern:
- Consider the market’s trend and technical indicators — an upward price action for a bull market and the opposite for a bear one.
- Distinguish the classic silhouette from other parts of the chart;
- Check the distance between the shoulders and the focal point of the structure. The difference is equidistant in the best case or near it on average.
- Connect the peaks or lows of the trend and accentuate the pattern’s neckline — horizontal or one with a small increase or decline.
Chart Head and Shoulders Pattern Interpretation
Despite the seamless characteristic of a traditional head and shoulder stock chart, knowing unique nuances will contribute to the efficiency of your deals and critical thinking in general. Besides, the pieces of data below might come in handy to help you avoid misleading signals.
Delving Deeper into the Meaning and Implications of Head and Shoulders Chart in Technical Analysis
Head shoulders stocks can result in one of the following scenarios:
- In several shoulder patterns, the asset’s cost indicator pulls back to its resistance level after the exit. Such an event doesn’t provide the highest profitability of the deal possible.
- One of the most typical outcomes is a bearish head and shoulders pattern when the trendline’s break is the moment when the upward tendency resumes.
- The intensity of the trend depends on the duration of the left-shoulder-to-the-head movement — the longer, the more accentuated the head and shoulders top.
- The abruptness of a price move before the establishment of the target pattern influences the strength of the trend’s continuation after the second reversal.
What Is Head and Shoulders Pattern Psychology?
In the best-case scenario, navigating through head and shoulder charts has to take place when a trader is calm and confident in their strategies. Otherwise, the vision of chart patterns head and shoulders can be blurred and disrupted by news in finance and other criteria. That is why risk management and systematic trading are better than behavioral shopping for stocks to invest in or sell.
Head and Shoulder Pattern Stock in Trading
A head and shoulder indicator is a brilliant opportunity for enthusiasts to utilize a reliable tool and define trend reversals without difficulty. If you don’t know how to start your journey as a trader, a head and shoulders pattern stock is also a nice guide on how to enter and exit the market with a successful trading plan or a stop-loss order.
Here are some more reasons why the number of people implementing head and shoulders trend keeps increasing:
- They use its data to verify the market’s state and its sentiment. This shift from a bearish to a bullish trend or vice versa in the inverse version shows that the demand for buying and selling stocks isn’t well-balanced and is going to alter soon.
- It is a flexible tool to apply for both short-term lucrative deals and long-term investing strategies. Its adaptability makes trading user-friendly for a diverse spectrum of interested parties.
- It is also a versatile solution to analyze a price move in commodities, stocks, and other financial markets.
Top-Notch Strategies to Implement Head and Shoulders Technical Patterns in Trading
Although asymmetrical head shoulders trading is more complicated for newcomers in the field, tuning a custom tactic will be a sufficient move:
- You can wait for the continuation of the trend and catch the next peak momentum of its uptrend or downtrend to make a stop-loss order. Depending on your objective, buy-and-sell operations may vary in scale and caliber a lot.
- One of the popular approaches is a so-called breakout strategy. Its efficiency for forex head and shoulders patterns isn’t at the highest rate — locating your entry position at the early stage of the price movement after a change may lead to disappointment. The reason for that is the risk of a false signal.
- In the framework of consolidating financial markets, trading based on head and shoulders patterns can be an effective measure to earn extra funds. Please check if the overall price movement doesn’t break out either the resistance or support level.
- The “head” moment can serve as a foundation of a professional reversal trading strategy. Since the analyzed market spots the shift in the market sentiment, it is a marvelous opportunity for short-term trading decisions. It can prove its worth in bullish and bearish trends.
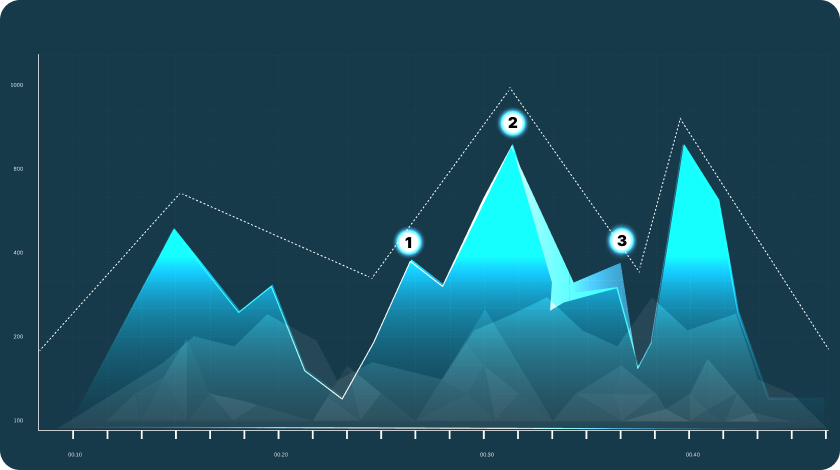
Real-World Examples of Head and Shoulders Trading Signals
There is no strict hierarchy, defining what patterns precede and follow the head and shoulders graph. You can easily spot how distinctive case studies can be in practice. In the picture below, there is a pretty symmetrical phenomenon in the chart of Amazon’s stocks.

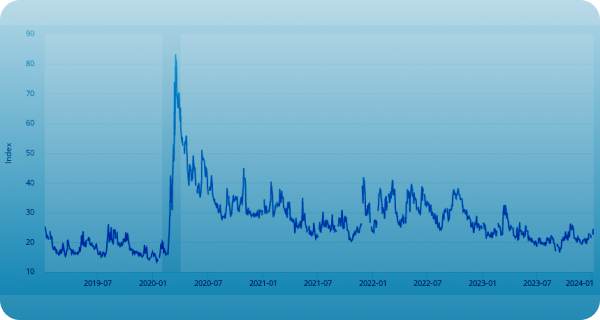
To stay on the safe side, it is great to wait until the pattern is complete to the fullest. This way, you won’t act arrogantly or with anxiety — your decisions will depend on the actual data on chart head and shoulders patterns. Take a look at how the market acts before and after this pattern is over — check the chart of Russell 2000 stocks.
The Pros and Cons of Stock Market Head and Shoulders
Since the only structural difference between a classic and inverse head and shoulder graph is contextual, both have similar advantages and disadvantages. Accompanied by other patterns, head and shoulders pattern technical analysis will help interested parties set clear trading goals and mitigate the risks of their deals.
When it comes to head and shoulder candlestick patterns, it is important to remember their distinctive peculiarity — their formation is possible only at the very bottom of a downward or upward trend.
The Reasons Why Head and Shoulder Pattern Stocks Are a Good Choice
The fundamental benefit of head shoulders stock is its data-driven analytics. Such graphs are easy to interpret its results since they indicate where risks threshold. The same goes for the recognition and placement of profit targets — they are simple to measure and align with a custom trading plan.
Overall, the design of a head patterns chart provides well-defined levels for stop-losses, take profits, entries, and exits. Instead of jumping into any bargain and seeing how it goes, it is way more advantageous and profitable to track the movement of asset prices and enter the deal before the necklines break.
Potential Challenges & Risk Management for Head and Shoulders Topping Patterns
The main drawback of both head and shoulders pattern bullish and bearish charts lies in their subjective nature. Although they stand out with a set of distinctive features, the definition of a price move isn’t only about its upward or downward trend.
In addition, a strong trend occasionally disrupts the classic formation of the target pattern and doesn’t make a price move alter its direction. In practice, it keeps following the leading bullish or bearish trend after a short reversal pause.
Overtrading is a common issue for novice players in the market. Even if they know “What is a head and shoulders pattern?”, a few start by determining the prospective profitability of the deal. What’s more, the habit of purchasing or selling stocks because of psychological triggers is pretty complicated to overcome. Panic, exhaustion, recommendations of famous influencers, etc. — there are several causes of emotional trading.
Final Thoughts
At the end of the day, investors easily fall in love with a head and shoulders stock pattern — its reliability stands out. Although there is no 100% that things will keep going as projected, its signals are usually quite straightforward and precise. With the help of stock chart head and shoulders patterns, both beginners and seasoned raiders figure out whether the trend reversal will take place.
Compared to other methods, including wedge flags and pennant patterns, this type is easy to locate and verify. Although its formation is a long-term process on average, it can deliver lucrative results and let you define the most optimistic market moment for a deal.