The variety of tools to boost technical analysis and complete successful trades is impressive. With flag and pennant chart patterns, as well as head and shoulders, double bottoms, and other alternatives, you are up in arms for any drastic price fluctuation.
In this guide, let’s focus on the nature of pennant formation technical analysis and what tactics will contribute to your expertise in the field. Onwards!

Technical Analysis Insights About Pennant Trading
Before diving deeper into today’s topic, here are some frequently asked questions with concise and informative replies. Start your journey in the market knowledgeably:
- What does pennant mean? This term is for describing a price move of a certain asset or stock. It defines one of the consolidation formations that fits into the category of continuation graphs in the field.
- What does a pennant look like? With a neutral slope, the geometrical shape behind the layout is a small triangle. However, it comes with symmetrical sides and resembles a cone once the trend accelerates and is close to its culmination.
Pennant Chart Patterns in a Nutshell: Structure and Characteristics
Here are a couple of facts to shape the discovered phenomenon without omitting its core elements:
- The breakout of the chart pattern will coincide with either the upward or downward movement of the preceding trend.
- The lower and upper trendlines aren’t parallel — they will converge pretty soon after the start of the pattern’s formation.
- Experts typically spod the decline in the volume throughout the consolidation period.
- In most cases, such scenarios are transient shifts in the asset’s price behavior. They may be valid just for a few days — it isn’t a rare thing at all.
- The peak duration of the pennant chart pattern doesn’t usually surpass a couple of weeks.
Key Features of Pennant Stock Patterns
It usually occurs in the framework of more aggressive trading settings, which implies higher risks and rewards. Compared to other categories, such layouts form rapidly yet don’t last a long time. They are characteristic of trends that are just gaining their power and are around halfway through their establishment journey.

Pennant Pattern Trading Strategies to Trade Like a Pro
Now that you know whats a pennant is, it is high time to discover efficient methods to earn money on price fluctuations of a certain asset or stock. Contrary to other types of charts, the distinguished type requires a more in-depth analysis of risks and benefits before completing the deal.
Working with Pennant Pattern Stocks
Here top three strategies to transform pennant flag patterns into a lucrative business bargain:
- Take profit and stop-loss orders — it is a must to think twice before setting the buy-and-sell limits for the target order. The rule of thumb is to choose the levels above the trendline for bearish charts and below the drop rate for bullish tendencies.
- Verification indicators — aside from the spotted shift in the price itself, consider other technical parameters to confirm the current state of the asset corresponds with the standards for pennant patterns. Volume and moving averages, to mention a few, will come in handy.
- Breakout — it is a common tactic for different kinds of charts. In this case, you take the most out of the direction change. N.B. Don’t forget to stick to the breakout’s guide — follow its direction when making your trading decision.
Real Use Cases of Pennants Patterns in Trading
After a large upward advance, investors may notice this formation’s appearance. This change may indicate a brief trend lull but with a strong suggestion that the previously dominant trend will come back and keep its price-increasing nature. That’s when long-term trading positions are most popular.
For those who want to boost their strategy’s efficiency, it is essential to consider volume indicators. Money Flow Index, On Balance Volume, and others will assist enthusiasts in determining the selling and buying pressure while the formation of the pattern and breakout is ongoing.
Pennants Trading and Technical Analysis: What Is a Pennant Formation Style?
The basic formation feature of the distinguished pattern is as follows — it occurs after a significant change in the asset’s price move and has a temporary character. In the candlestick chart, you can spot a few longer candles followed by small ones — blue and red or green or red to display rising and ascending patterns.
Considering the Pennant Stock Chart Formation Process in Detail
Overall, pennant formation technical analysis includes the recognition of its core elements:
- Flagpole — this term describes a large price move alteration.
- Consolidation phase — after a shift, a small reversal takes place and leads to the trendline converging.
- Breakdown — that is the point when the pause moment is over and the original price move alignment returns.
What Influences Pennant Trading Patterns and Their Formation?
Both bear and bull pennant patterns are highly responsive to the following parameters:
- technical indicators, including moving averages and volume;
- crypto trading and mass market psychology;
- economical news and events;
- the length of the previously dominant trend;
- market sentiments;
- market volatility.
By gaining a deeper insight into what changes come into action once one of the above or they alter their indicators altogether, traders will contribute to their critical thinking flexibility and risk management strategies.

Bullish Pennants Explained
Rising pennant patterns in technical analysis are for signals that impend the comeback to a significant rise of the target asset’s cost. The key secret to figuring out how to trade with bull pennant chart patterns is simple — you have to wait for a bull pennant breakout and either make short deals to earn rewards or wait for the next peaks and sell your stocks then.
Falling Pennant Charts Definition
The standard approach to describing forex pennant patterns includes the description of its core elements and the emphasis on its distinctive features. When it relates to pennant pattern charts, they show a price move against the prevailing downward trend and the following return to its parameters. Bearing pennant chart formations in financial markets might slightly differ because of the volume peculiarities, for instance. In turn, traders have to navigate the trending lines and wait for the breakout moment.
In the case of false signals, bearish stock pennant patterns won’t surpass the support level after a pause. Other scenarios might occur as well, which means verifying the pattern and its value is a must for any interested party.
Triangle Patterns vs. Classic Pennant Signals
Pentant drawing can be quite tricky and confuse novice members of the crypto trading community. Taking into account how volatile the majority of cryptocurrencies are, it is crucial to raise your diligence and attention to detail. Although the difference between pennant reversal patterns and some of its analogs is minimal, it exists and waits to be discovered. Mind the gap!
Distinctive Features Between Pennant Pattern Stocks and Triangles
You won’t find drastic distinctions when comparing triangles and pennant patterns:
- The two relate to the continuation category of charts.
- The volatility of the target asset’s price decreases.
- Both shifts are short-term.
On the one hand, you can spot the type you need based on its visual characteristics — the names of both options are self-explanatory and tell beginners about their silhouettes. On the other hand, the breakout direction is what matters. While triangles can shift in any way, pennants follow the prior trend.
When to Use Pennant Chart Trading Pennants vs. Triangles
These two methods are pretty reliable and let interested parties recognize the upcoming shift in the target coin’s or asset’s price movement. Pennant patterns, however, will be more sufficient in cases when it is necessary to take a competitive edge over a decline in the cryptocurrency’s volatility.
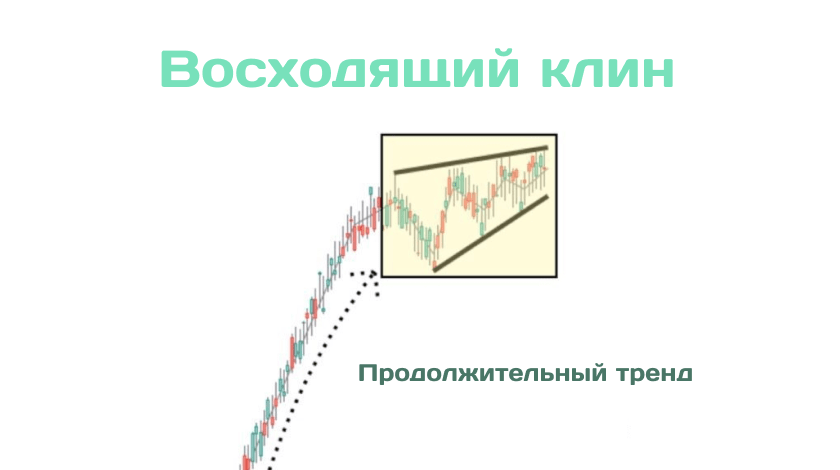
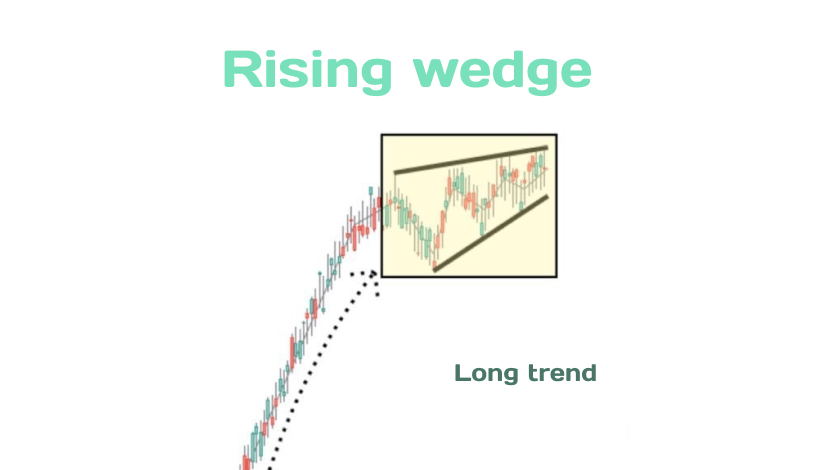
Rising and Ascending Pennant vs. Wedges
To start with, their shapes are unique. You won’t mistake a wedge for a pennant and vice version. Their relation to the current trend and the overall market also varies:
- While wedges signify the market’s reversal, pennants inform that the current performance will be ongoing for a certain period.
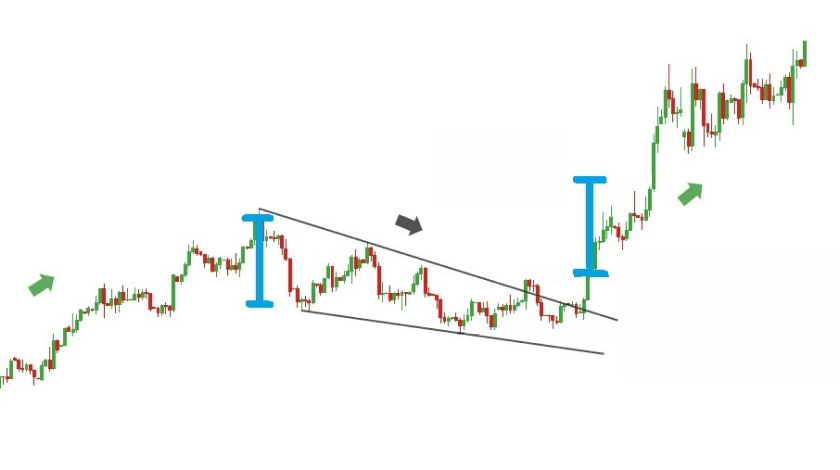
- The breakout pattern is against the trend for wedges and aligned with it in the case of pennants.
- Wedge chart patterns won’t result in the decrease of the price volatility — the opposite happens.
Selecting the Right Pennant Stock for Your Analysis
Whether you deal with pennant formation bullish or bearish types, identification and verification procedures come first. With more distinctive alternatives like wedges, novice traders are unlikely to make beginner mistakes and misjudge the value of pennant chart graphs. Your task is to spot the trend direction and the breakout point and decide on what financial instrument you will use.
Pennant Formation Technical Analysis: Limitations & Risk Mitigation
The best trading strategy will always be a matter of personalization and expertise. A lot depends on whether you focus on bull pennant stock patterns, want to wait for further market and trend changes or try a new financial instrument within the paradigm of pennants. Stop-loss orders and other precautionary measures from this guide will lessen the amount that could be lost if the breakout doesn’t take place.
Besides, it is a good idea to measure the risk tolerance of the target asset and decide on entry and exit points by tracking the peculiarities of pennants for a bull or bear market.
Final Thoughts
From questions “What does a pennant sign look like?” to applying the data from bull pennant stock patterns in practice, the journey from acting like a beginner to being a pro is surely fascinating. When it comes to dealing with descending pennants and bull pennants, your top priority is to verify what you see in the price movement trend and make a well-thought-out trading decision to accomplish your goals.


