One of the contemporary leading methodologies to back up trading with data-driven decisions is to use chart patterns. With several types available, they help get a better grasp of price moves and other related indicators for maximizing the likelihood of a successful trading deal — volume, valley, support, resistance, and so on.
A flag pattern in forex and other financial markets is the most basic solution to tune technical analysis and confirm the interpretation of other charts. Boosting your awareness of its characteristics will predetermine how knowledgeable and skilled you are in seeing entry and exit signals and advance your long-term and short-term tactics. Keep on reading this guide to see whether a chart patterns flag can become a perfect financial instrument in your case. Mind the gap!
Deciphering the Meaning of Flag Patterns Stocks
Finding particular formations, including flag forex patterns, depends on how well you understand their composition and peculiarities. The process of spotting such shifts in prices doesn’t necessarily have to rely on your interpretation solely. In addition, you can complement your strategy and tech analysis skills with the help of specialized charting software. Numerous modern exchanges also come with in-built financial tools to identify a certain structure of price moves.
By combining your effort and auxiliary methods like AI technologies in bull flag technical analysis, you can achieve your goals in the safest and most lucrative manner possible. But first things first — what is that flag chart pattern in practice? Let’s find it out!
Delving into the Implications of Stock Chart Flag Patterns
When the cost of a stock increases quickly over a brief period, it forms a flag. This growth or decline, depending on the bearish or bullish trend in the market, will be a flagpole of flag patterns in trading. They are just temporary stops in the overall dynamic environment.
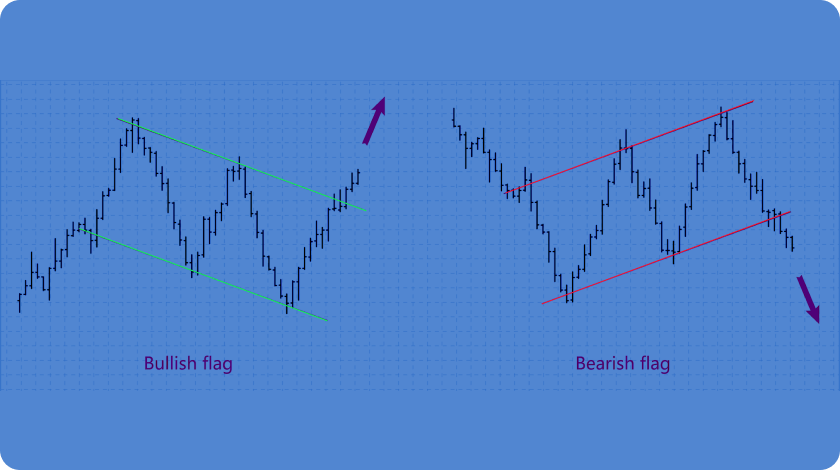
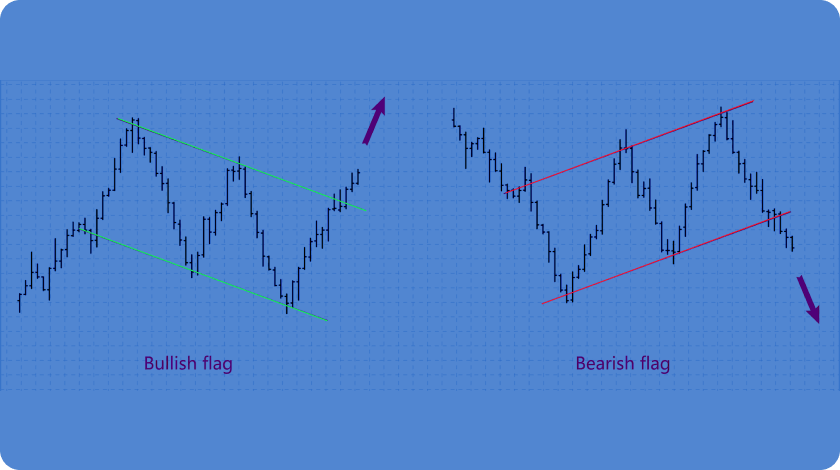
A consolidation phase is presented in the silhouette of a rectangle in flag patterns trading. Typically, they form in the middle of a complete swing. Such charts solidify the previous action and present new highs and lows in the target stock’s or asset’s price fluctuations. In the long run, stock market flag patterns visually establish two parallel lines, where peaks and drops are correlated to one another.
The Psychology Behind a Flag Pattern in Technical Analysis
History repeats itself, and the same is valid for flag patterns in trading. However, the predictable nature of price movements is also due to human behavior peculiarities. The recurring feelings of greed, satisfaction, anxiety, and so on when the cost of an asset shows upward and downward trends lead to the formation of flags and other types of chart patterns. The mass psychology effect is drastic — while an increase in demand for a certain stock rushes its price growth, the opposite can promote its rapid drop.
The chronological order of chart patterns isn’t a thing. Any observable category of continuation and reversal patterns could start and end at any moment. For this reason, taking a closer look at line, bar, and candlestick graphs is so influential and beneficial for people who want to earn money via brief or long-term price fluctuations.

Discovering the True Nature of Flagging Patterns
Flag stocks are wonderful instruments for financial decisions, letting interested parties define whether the further price movement will continue to follow the current trend’s direction or will alter. If all the conditions are met and the trend remains ongoing, trading flag patterns signify a rapid growth in the asset’s cost. Keep on reading to check how the chart’s nature helps navigate through the turbulence of the market.
The Main Characteristics of Flag Chart Patterns
The efficiency of flags technical analysis doesn’t let investors of any caliber abandon this graph to drive their strategy in the chosen market. On average, the end of the pattern doesn’t disappoint the initial expectations of specialists in roughly 65% of situations. This success rate is what entices more enthusiasts to try it in practice.
Experts define four core elements of its structure. Although the visual aesthetics will differ in dependence on the downward or upward trend, the general concept remains the same whether you deal with a classic or a reverse flag pattern.
The Dominant Trend
Although the frameworks of bearish and bullish are alike, the specific variations in the volume and direction are their distinctive features. A bearish pattern starts higher in the graph and eventually tends to boost its rally in the long run. In comparison, the reverse flag pattern reduces its price move and volume during the consolidation stage and vice versa during the preceding trend.
Volume
The signs of bear and bull markets in flag pattern volumes are the same. Once a price starts increasing, the demand for its sales drops, which causes a natural decline in the trade volume. Here a rising flag suggests that during the consolidation phase don’t have to be as eager to manipulate the number of their stocks. Following an initial spike, there is a chance that more third parties will check the market, see this trend, and become interested in new buy-and-sell deals.
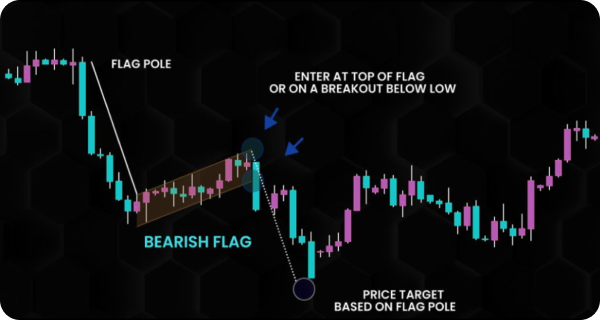
The price target calculations are also unique — after defining the flagpole (namely, a significant price movement) length, it is necessary to add this figure to the breakout point. Trading professionals can get a lot of influential hints from such chances in the trend direction and adjust their stock sales techniques.
Breakout
Its anatomy is straightforward — it is about the price rally with a greater volume that occurs outside of the designated resistance or support area. Breakout traders keep monitoring the market to spot the moment when the cost movement’s peak or low surpasses support or resistance to open short or long orders, accordingly.
In the flag chart environment, the distinguished pattern is real when the breakout direction of the previous and current trend out of the consolidation zones coincides.
The Ultimate Guide for Identifying a Flag Pattern
Bullish or bearish flag formations come in handy and let traders spot the market sentiment and make predictions about further changes in the asset’s cost. Understanding how they form and influence price fluctuations will predetermine the best entry and exit moments for traders and the volume of buy and sell operations.
Here are some flag examples to help you identify flag indicators in real-world cases of technical analysis:
- Let’s assume stock A will experience a bearish chart pattern. In this case, you will track a sharp decline in its price — a flagpole from $100 to $90. It is too early to confirm the pattern. You need to wait for the subsequent rise and break through the support line (one connecting its lows along the way) — around $94 or $92, for instance.
- If you want to confirm a bullish flag pattern, its price fluctuation should break above its resistance line, which is the upper boundary of the pattern — its peak cost indicators on the graph. In this scenario, the cost of stock B will rapidly rise from $25 to $35 and reach its consolidation phase at the rate of $30, give or take.
What Happens Once Flagging Stocks Are Detected
Knowing the right kind of current trend in a market at any time is what assists interested parties in making successful trading decisions. This way, flag pattern stocks play a crucial role in clarifying goals for investors and delivering straightforward guidelines on what to do. If the market is gaining momentum, it is a good idea to restrict from either selling and buying funds or trading along the trend.
Price Fluctuations After Technical Analysis Flags
Here are the leading traits that characterize price moves in the framework of flag charts:
- The price keeps moving and aligns with the main direction of the dominant trend, be it downward or upward. It takes place right away after the consolidation phase finishes.
- Chart flag patterns are an efficient tool to identify the market’s nature. Understanding whether the price of a stock is rising or ascending points to the current level of demand for the target asset.
- Don’t forget about the fundamental feature of stock flags — it signifies a short pause in the trend and confirms its further comeback to the previous “plan”.
Flag Patterns Technical Analysis — Post-Breakout Tactics
In a nutshell, bullish and bearish flags are continuation patterns — no drastic changes of price moves in the opposite direction are projected. Although low-volume highs and lows may take place, the big picture will remain the same. After the cost of the target asset departs from the flag segment, it is necessary to wait for the further continuation of the trend and avoid the trap of false signals.
A custom trading approach usually depends on the version of flag formations, as well as the original objectives of an investor. Interested parties typically create stop-loss orders when a flag pattern breakout confirms the decision’s validity and the predictable nature of the asset’s price movement. Don’t hesitate to abandon the trade, especially if there are controversial indications or there is no additional confirmation of a trend reversal to either an upward or downward side.

Flags Patterns vs. Other Chart Pattern Formations
Patterns in trading are always situational. Their confirmation depends on several parameters altogether and will be invalid if at least one of the structural elements is off. Since novice users find it difficult to understand what is what and easily make technical analysis mistakes, now is the time to overcome this issue. Enjoy successful trades with minimized false signals or wrongly interpreted ones!
How to Distinguish Patterns for Flags from Other Variations
While trade flags are quite distinctive in comparison with several kinds of patterns, including double tops and bottoms, there are similar charts to be aware of. To avoid any confusion and estimate the pros and cons of the target deal under particular circumstances, take into consideration the following:
- Parallel lines of support and resistance levels are what distinguish this trend from others. In a more classic version, its shape will remind you of a rectangle and indicate a brief cooldown in the market contrary to the dominant nature of the dominant market — bear or bull.
- Flagpoles in the analyzed kind of patterns might be confusing and resemble a pennant a bit — its shape is triangular then. In turn, the main difference between pennants and trading flags is that trend lines converge here. A breakout of a pennant chart pattern can happen and move either way, indicating the imminent nature of a trend reversal.
- For people comparing another pair of similar patterns, namely, channel and flags, it is crucial to pay attention to their duration and volume. Channel chart patterns usually take over a month to form, while a standard flag in trading is over in about four weeks.
How to Select the Correct Flag Forex Indicator
Investors appreciate flag trading patterns for their efficiency. It will work whether you want to flag identify a bullish market or the opposite trend. It won’t be extra to accompany this strategy with other efficient tools. Diversify your portfolio with head and shoulder, double bottom, ascending triangle, and pennant chart pattern instruments.
The Classification of Flag Stock Patterns
Some experts expand the barriers of typical flag types and include other kinds without a parallel hierarchy of upper and lower trendlines:
- Wedge — in this case, the market will keep going only when a wedge-silhouetted chart signifies the end of its consolidation stage.
- Pennant — small rectangles and curved flagpoles are the features that distinguish pennant flags from traditional pennants with big rectangle-shaped structures and straight poles.
- Tight and high — the frequency of shifts from the break to continuing the trends and back is bigger, which means the duration and length of flagpoles on the chart will be smaller than in classic-case scenarios. The distinguished type of flag chart patterns is especially common when the dominant trend is upward and the market is bull.
What Are the Three Types of Flags?
Flag formation stocks belong to a major group of patterns, signifying the continuation of the in-market trends. Specialists also determine such categories of charts for boosting end-user trading decisions:
- Reversal — as the name implies, it is a rapid shift in the price movement style. There are signs of reversal in flag patterns as well. However, they are usually for indicating long-term alterations rather than such brief take-a-break moments.
- Bilateral — you can consider failed flag pattern predictions as the tricks of bilateral charts. In this case, a price movement style can change and keep going in any direction.
If trending flags don’t follow the standard pattern and remind you of bilateral and reversal trend identification in the market, it simply means your initial assumption is wrong. It will be better to double-check your original theory and verify if it is a genuine flag for a bull or bear market.
Bull and Bear Flags: What Is the Difference?
Distinctive features between so-called bear and bull flag patterns are pretty clear to understand and simple to remember:
- What is a bear flag in stocks? To sum up, it is a brief stoppage of the previous price decline. It denotes a stage of consolidation within an ascending trend and upward going market.
- Suppose a bear flag looks in a mirror — a bullish flag chart pattern would be the result. A momentary pause in the market dynamics is for a short-term increase in the stock’s cost, but it doesn’t change the major price movement direction. The latter is a downward one.
Flag Pattern Technical Analysis and Trading Peculiarities
If you wonder what the best deal to deal with flag forex patterns is, you have come to the right place. Let’s roll straight into expert suggestions on how to harness their power in practice:
- Purchasing stocks at the lower trendlines and selling them within the peak resistance zone is the primary tactic. Known as the range trading method, it is perfect for professionals who are capable of managing the asset’s cost swings inside the flag pattern.
- Depending on when the breakout occurs, you can succeed in buying or selling a stock for a lucrative here-and-now deal. It suits active investors the most. Focus on weekly charts in this case — they will provide more accuracy in spotting the appearance and ongoing cycle of flag patterns.
- Compared to the breakout strategy above, this tactic lies in tasting your patience and waiting for the moment when the target price retraces to its position before or after the flagpole occurs. The pullback strategy is quite a self-explanatory name from this perspective.
To-Do List for Trades with Chart Flags
Flag formation technical analysis and trading involves the following steps:
- Spotting and identifying the pattern — this stage will assist in determining your action in the market and the best moment to enter and exit it.
- Stop-loss — the opposing side of the analyzed chart pattern will be your focus point. Locate the first stop-loss of the deals below its trendlines if it is a bearish market. When the trend is bullish, place a stop-loss below the upper trendlines.
- Profit target — this calculation is a sufficient tactic to determine the right moment to exit the deal and ensure its lucrative nature.
Risk Mitigation and Top-Notch Practices for Trading Flags Strategies
Rising flag patterns and ascending flag patterns provoke different actions, they assist in completing successful short deals of sells and buys, accordingly. Still, the first rule of any successful trade is to confirm the current pattern doesn’t send false signals and increase your chances of failure instead.
With the help of efficient risk management strategies, interested parties will be able to navigate through their assets and trading techniques while minimizing potential losses at the same time. Although the results of the deal might be far from satisfactory, the right mindset will cover it up:
- Avoid emotional “shopping”. No matter what, your actions in the market are to be well-thought-out and with critical thinking tricks in mind. Don’t hesitate to plan your buy-and-sell battles — it will help you be up in arms once the flag pattern occurs on the chart.
- Take-profit and stop-loss strategies are must-haves for a contemporary trader. The first approach comes in handy to estimate the general profitability of the deal and whether it is worth it in your particular case. On the other hand, stop-loss orders protect you from losses once the trading decision is made.
Key Takeaway
At the end of the day, a flag example shows how novice traders can get peace of mind and make their first steps in the market more confidently. Although the science of trading based on technical analysis principles may seem a bit complicated and even overwhelming at first, this expertise is what distinguishes a beginner from a pro.
Delving deeper into how chart patterns work is essential, but risk management is no less important — no matter what trends you see, these indicators are never 100% precise and accurate. What’s more, their responsiveness to exterior market aspects such as economy data is minimal.
Nevertheless, trading strategies based on flag chart patterns can lead to successful deals. Extra precautions and diligence will contribute to the overall experience and your satisfaction as an investor.