Modern traders can work with multiple schemes and strategies to ensure they gain maximum profit from an in-depth understanding of the bullish and bearish market. However, it is essential to check hidden nuances and pitfalls in the field to boost streamlined performance at your end. One of the advantageous patterns to pay attention to is a chart for rounding.
Although the trading realm doesn’t quite always follow textbook definitions, you are pretty safe when it comes to rounded charts — they can easily deliver high-end profits in the right hands. Your task is to see how such patterns work to pick effective entry and exit points for maximum efficiency. Keep on reading to expand your trading horizons with round patterns and charts.
Getting to Know More About Rounding Tops: Core Characteristics and Significance
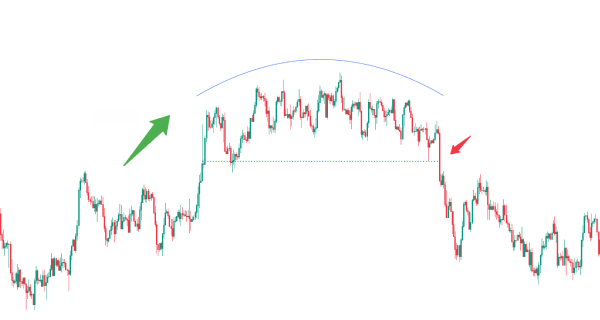
What is rounded top pattern in trading? Its name explains its visual graphics pretty precisely. In technical analysis, this notion is used to describe a pattern that forms a predecessor of a bearish trend and signifies the last moments of a bullish trend before the change of its price motion course. Its rounded curvature takes place at the upper part of the chart, which resembles a bowl or similar-shaped object that is turned upside down.
If you see an analogous picture but in a reversed manner, this graphic element will now be called a rounded bottom pattern. Keep on reading for a more detailed depiction of round patterns in technical analysis.
Upward Trend
This price motion configuration usually appears once a protracted advance in the target asset’s cost takes place. In turn, this graphic alteration will be a straightforward signal that buyers have been in charge of its motion for a certain period.
Gradual Curve
The distinguished type of graphic in technical analysis isn’t alike in comparison with head and shoulders and other patterns, where the change in the price action motion is rapid once a high peak is reached. Instead, it illustrates how a smooth and round-silhouetted curve is settled. In simple terms, this gradual shift can be explained by the fact that the purchasing interest in the target asset is slowly but steadily decreasing while the related selling activities tend to be growing.
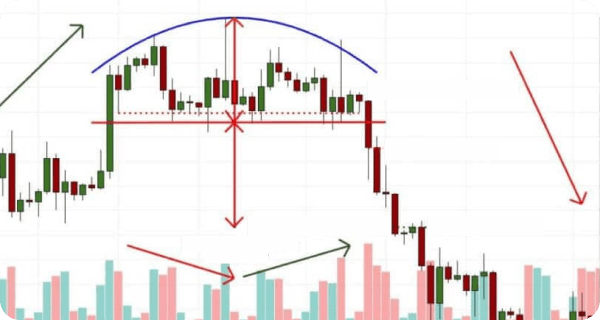
Volume
As you can guess, the amount of completed buy-and-sell deals declines during the creation of the rounded top pattern. If you analyze charts attentively, it will be quite an easy challenge to spot this drop in buyers’ commitment and the start of the paradigm shift.
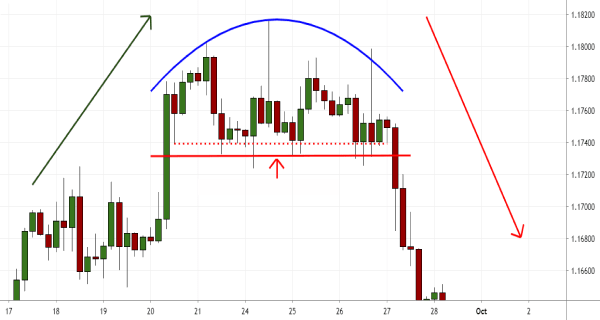
Resistance Line
As in the case of other patterns, the top of the pattern signifies its resistance line. Once the price has failed to keep its upward trend, you can draw a line that marks the overall graph’s top at the moment.
Confirmation
To validate the pattern, you have to define the support level first — it’s usually the lowest point of the curve. The rounding top formation is deemed finalized when the market cost falls past this level. You can define the support level line by the price limit of an asset that hasn’t been crossed below for a certain timeframe.
In-Depth Analysis of Rounded Top Formations: Checking Trends and Patterns
Contrary to round patterns, its bottom alternative is reversal. It indicates the conclusion of a decline in the price motion trend and the possible start of the upswing. Volume and price will always be seen as critical markers for recognizing and establishing this trend.
While it may seem as simple as ABC to look for this pattern in theory, the practical execution is quite different. Both rounding top chart patterns and bottom variations can require days, months, or even years to be completed. With a relatively high level of success and profitability, the so-called Saucer pattern is similar to the likes of the cup and handle chart, as well as triple top and double top graphics. To distinguish between a rounding top and a cup and handle chart pattern, for instance, you will have to pay attention to the direction of the pullback at the neckline zone — it is bullish and bearish, accordingly.
Real-Life Samples of Rounding Definition: Rounding Chart Patterns and Scenarios
Let’s consider a random four-hour time frame in the GBP/USD chart. The bullish trend started at the rate of 1.3408, which also became the profit target for this case. The rounding top pattern reached its peak at the rate of 1.3448 — the best moment for a stop loss order to be placed. Then a noticeable bearish movement took place. A nice market entry and sell moment was spot at the price level of 1.3428. Such examples of rounding top chart patterns are valid for the price flor of fiat money and cryptocurrencies. The key feature of applicability for the analyzed rounded top chart pattern is to ensure you choose the right moments for stop-loss orders, as well as market entry and exit points.
Strategies for Trading Rounded Top and Bottom Patterns: Expert-Approved Tips and Techniques to Boost Your Success
Without a doubt, any trader has to remember that defining rounding top pattern bullish trends is just half the deal. You have to be up in arms to embrace any drastic and unexpected changes in the pattern. To ensure your funds are protected, it is a must to combine your understanding of rounding tops with risk management strategies and other technical analysis parameters.
No matter how straightforward rounding top patterns are, there may be a chance they won’t guide you in the right direction. They might change to the format of double tops or any other silhouette on charts. The key secret to adapting your trading technique to such fluctuations is to ensure you’ve switched on your stop-order mood.
It is important to stick to stop orders specifically. Limit orders won’t help you pursue all the desired goals in the case of rounding top and bottom pattern trading. They are typically more advantageous for traders interested in lasting positions in stock at a specific cost of the target asset.
How to Define Bullish Chart Rounded Top Patterns: Signals and Trading Opportunities
The answer to the question of defining the rounding top pattern bullish or bearish nature is easy — it is an indicator of a bullish trend in a traditional format and a bearish one in the case of rounded bottom patterns. To clearly see them on charts across markets, you will need to spot three crucial elements:
- The asset’s price fluctuations paint a smooth change from a small increase to a small decline in the cost, resulting in a rounded silhouette.
- You will locate the support price level at the graph’s base.
- Traditionally, such patterns come with a reversed volume arrangement, having a lower price in the center and a higher level on one of its ends.
For traders, such price fluctuations denote a potential increase in the number of share sales in the market. The reversal U-shape can also take place in double and triple top patterns, which shows the ever-changing mood of the audience in the decision to hold or sell their stocks.
Using Rounded Top Stock Chart Pattern Screeners in a Nutshell
If you have a more or less precise vision of the asset or company you are looking for to satisfy your investment goals, stock screeners will come in handy. With their help, it will be easier to filter out different stock movements and spot round chart patterns. Finviz, Yahoo! Finance, and others can certainly be included in the list of the best stock chart pattern screeners in 2024. They work as algorithms decided to handle and analyze large volumes of data thanks to a set of adjustable and customizable variables, an advanced screening engine, and a large database of companies.
By answering the questionnaire in the frames of mastering the science behind stock screeners, you will narrow down the palette of stocks and define those with the right metrics for your trading goals. Here are a few free tools that will come in handy for beginners in the market:
- FINVIZ — this software lets you locate certain chart patterns and distinguish between rounding tops and channels, triangles and head and shoulder patterns. Not only does it help you access Forex markets and futures horizons, but it also provides a great insight into up-to-date trading trends and insider trading.
- Autochartist — this popular solution lets you get the most out of its real-time notifications about the activation of technical parameters of your choice. Its engine empowers traders with real-time and actionable insights about market price motion, letting you not miss profitable opportunities hidden behind rounding top and bottom patterns in charts.
- StockCharts — given how long-term the execution of rounding top charts may be, this program is among the most suitable options. It lets you establish custom price charts, RRG, and other graphs to simplify your technical analysis of intraday, monthly, or yearly price fluctuations of the desired asset in your portfolio.
- ChartMill — this offer stands out in terms of its flexible performance and versatile functionality. Its chart detection mechanisms are worth it for a vast number of trading strategies, be it dividend investing or a short-term buy-and-sell deal.
- TradingView — not only does it allow for simple integration with brokers, but this tool is also a sufficient choice for traders interested in customizable notifications and alerts in real-time. Its data and market coverage are great, letting you take control of its advanced charting tools to find the signals of rounding top patterns in a timely manner. It will work exclusively for global investing goals.
Backtesting Insights and Results: Rounded Top Chart Accuracy and Performance
It is one of the most popular trading tools. On the one hand, it occurs frequently across markets. On the other hand, there are no limits to its appearance in terms of available time frames. Given how straightforward their identification is in practice, it is a distinctive contribution to a beginner portfolio of trading mechanisms and approaches.
While it typically predetermines the arrival of lasting bearish trends, you shouldn’t underestimate how tricky it may be:
- When it comes to consolidating markets, the efficiency of rounded patterns isn’t 100%. They may provide misleading signals instead. In any case, a stop-loss order will protect you from insufferable losses at your end.
- On longer-term charts, this type of pattern isn’t quick in delivering profits. You will have to combine a diligent and patient approach in your strategy to ensure you leave enough space for rounded top charts to execute.
- Last but not least, although greater heights of such charts mean a bigger profit target, it also signifies a more expensive entry level for traders.
To opt for a lucrative accuracy possible with round pattern charts, you will have to stick to this combination:
- a sell entry located beneath the support line;
- profit targets that are placed below the pattern near the height of the pattern;
- stop losses set over the most recently recorded period high.
Practical Hints for Active Traders with Rounding Top Pattern Strategies
One of the must-have elements of your tactics should be placing a stop-loss order. It is of great importance, regardless of your experience and expertise in the field. The market can act unpredictably, especially when there are so many factors with a strong influence on its currencies’ volatility. So this precautionary measure will help you avoid a scenario when you lose all your trading bankroll because of a single wrong move.
By other means, using a rounding top pattern for trading is a pretty intuitive process. Here are a few more considerations for those interested in completing successful and profitable deals:
- First things first, your task is to see the right moment for a market entry. A beginner-friendly approach includes three steps — identifying the target pattern on the chart, defining the support line (namely, the neckline), and placing a sell order beneath it.
- The profit target is another crucial parameter of prominent orders. Check the distance from the upper extremity to the neckline to define a potential volume for the profit target. As the rule of thumb implies, the higher it is, the more advantageous the potential result can be.
The Bottom Line: Rounded Top Key Takeaways
Now that you’ve checked this guide on how to spot and use rounded patterns in your trading practices, it will be easier to diversify your strategies and find the most profitable entry and exit points. The key thing is to avoid any hustle and bustle and focus on clear signals, depicting the rounding top pattern bullish trend. It is essential to follow the market’s flow and adjust your strategies accordingly — trading against the trend won’t deliver the desired result.
With their typical U-shaped form in the upside-down configuration, it is one of the easiest patterns to analyze and determine on the chart, especially compared to the triple top, head and shoulders, and alternative alignments. In this case, the price motion is expected to be progressive and steady, with no noticeable surges along the way. It climbs up in a curved shape from the neckline before making an abrupt U-spin, signaling the conclusion of the current upward trend.
Before placing orders, ensure you get familiar with a bunch of rounded top examples to master your understanding of it from multiple perspectives. That’s when you will be able to gain profits from implementing its signals in your trading tactics.