If you think about experiencing what the role of investor and trader is, understanding what challenges you will come across will form the foundation of your prospective success. Navigating through the environment with over 9,000 cryptocurrencies as of 2023 and a market cap of more than 1.4 billion U.S. dollars might seem Mission Impossible at first.
However, with the help of technical analysis, even novice members of the community can make confident steps in identifying valuable assets and making well-thought-out trading decisions. One of the patterns to be aware of is a double top formation.
For those interested in the ability to predict resistance and support levels and spot price shifts for cost-efficient deals, double top pattern technical analysis is among the essential reversal and continuation charts to discover. What does a double top stock chart mean fundamentally? Stay tuned to check it out!
Double Top Pattern Definition
When a stock hits a high price twice in a row, but there is a slight drop between these peaks, this phenomenon is called a chart double top. It typically denotes a long-term or medium shift in trend. In such a period, the number of stock sales decreases.
Compared to other price-shifting indicators, it usually doesn’t guarantee large profits. At the same time, investors have to be careful to ensure they know how to identify this pattern and distinguish it from others. Nevertheless, understanding its principles of work will come in handy to elevate your expertise as a trader and help you make short-term yet efficient deals in the market.
What Does a Double Top Mean in Technical Analysis?
A double top candlestick pattern enables enthusiasts to have a better understanding of how the market works. Simply put, its nature is easy to explain with the core theory behind the science of technical analysis — history repeats itself. It is characteristic for prices to behave in a similar manner over time, which is why investors can spot stocks double tops, track their influence in the target environment, and adjust their trading strategy accordingly once they see analogous shifts in the asset’s cost.
By identifying this type of pattern, enthusiasts can achieve one of the goals below:
- By distinguishing and employing its resistance and support lines, among other indicators, it is possible to forecast price fluctuations.
- People use it to determine the prevailing trend. Distinguishing between the bull and bear market clarifies whether the stock’s cost will keep increasing or decreasing, accordingly, and what trading decisions will match the case.
- It is a nice bonus in technical analysis for people who attempt to ascertain how strong or weak the current price movement is and the likelihood of its continuation from a short-term and long-term perspective.
Exploring Double Tops
There is a significant increase that spans several months before a stock market double top starts taking its classic silhouette. The first top is a peak, which represents its maximum value during the trend. The initial upswing is pretty short-term — an up to 20% decline in the price follows.
Although this reduction isn’t huge on average, it can occasionally have a more long-term influence. This scenario will be valid if investors show less interest in the target stock and extend its cut in demand further. Once the shift in trend starts, it may take from one to three months to reach the second high. Aside from a low volume, another characteristic feature of the analyzed pattern is a small difference between its highs. While twin peaks are a rare yet possible scenario, it is about a 3% gap between the initial and the following high.
The Difference Between Double Top Pattern and Double Bottom
Is a double top bullish? The long and short answer depends on the correlation of price changes:
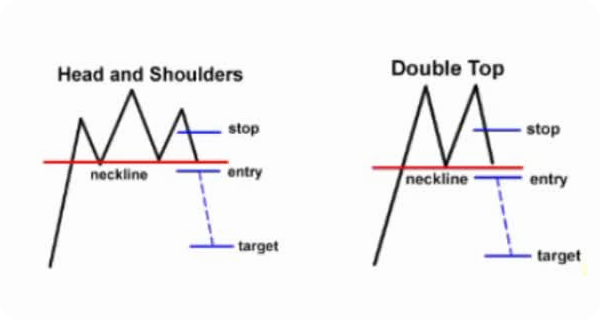
- In the case of a classic bearish reversal, this graph will have a letter M silhouette. In trend, it is a clue that selling will gain momentum over buying in terms of the overall market sentiment.
- What is a two top stock chart meaning if it is W-shaped? It is a signal of a bullish trend — from downward to upward. To be more precise, it will transform into a double bottom then.
The Psychology Behind Double Top Patterns
A double top target is a pattern of a bearish structure, so it won’t happen when there is a downward trend in the market. When the second peak appears, it simply indicates that the current bulls are weak and cannot drive an increase in the digital asset’s price any longer. As a result, interested parties anticipate that the rise of the stock will be over.
Both double tops and bottoms are influential charts to analyze — they have an impact on what actions will be best for an investor at the moment. The key problem is that these indicators aren’t beginner-friendly, despite their visual simplicity. The lack of experience may result in the wrong interpretation of the pattern and lead to a non-successful buy-and-sell bargain.
What Does a Double Top Mean in Stocks?
Before taking a close look at the strategy to define double tap in the asset’s price movement nature, it is crucial to understand the overall market’s tricky nature — false signals may occur. The rule of thumb is to track the level lines of resistance and support in the current trend. If the data you see in the graph comes without a backup in the form of these levels’ support, erroneous signals won’t indicate a trend reversal to a bearish market.
Identifying Double Top Chart Patterns: Instruction for Beginners
A double top candle pattern might seem a straightforward silhouette to see on charts, but it easily takes a few months at least to create it. That’s why it is beneficial to be aware of the approach to tracking the target asset’s behavior in the market and qualitatively spot and interpret its price fluctuations:
- First and foremost, your task is to monitor a price move and locate its upswing moments. It suggests that there has been a consistent upward trend in its peaks and drops.
- Once you locate such a high of this uptrend, don’t miss its short-term low — it is what experts call a trough line.
- The following change in the graph is the shift from the trough to the second high. In the case of a double top, you have to be cautious not to miss the moment of its consecutive fall — don’t wait all the way up to the initial peak’s indicator. In practice, it won’t reach its exact level and won’t succeed in this rally to surpass its previous result.
There is a way to guarantee the aforementioned scenario won’t become a fake alarm. All you need is to check the drop after the second high. If its level line is below the trough, you are safe. Otherwise, the pattern won’t be confirmed — there was no efficient surpass in the price fluctuation compared to its prior resistance rate. Put the cherry on the top of the cake by connecting the troughs of two consecutive peak-to-low shifts.
Double Top Chart Patterns and Indicators
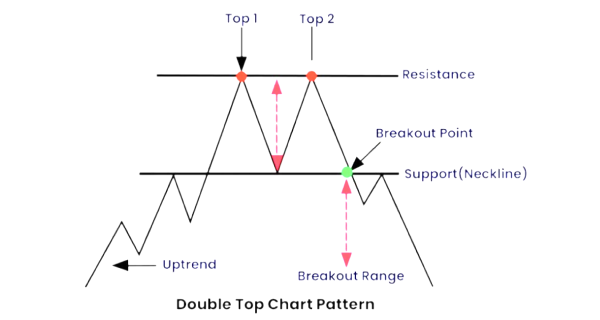
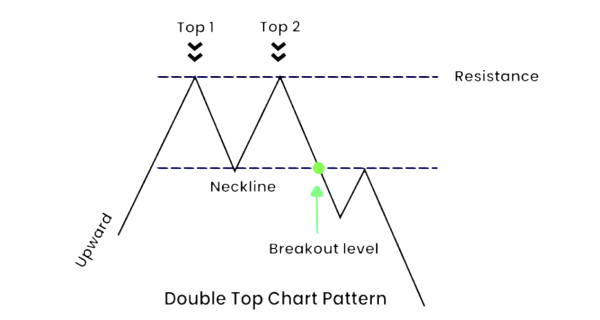
If you wonder “What is double top in five words or less?”, here is a quick answer — it is all about monitoring a price move for an uptrend with two peaks, a valley, and the neckline’s break. Delving deeper into technical analysis of this kind is essential, but this tracking activity doesn’t require 24/7 of your time and effort.
Although a lot depends on your personal preference, following the instructions above and checking a price move in weekly and daily charts is a good strategy to get started. Despite the fact that the distinguished kind of pattern is suitable for short-term trading, intraday charts might need to be clarified and provide less accurate data in this regard.
Double Top Stocks Reversal — Design and Functional Elements
In terms of double top stock analysis, another rule of thumb to remember is as follows — triggered double top chart patterns can be nullified. This scenario takes place if any motion or closure occurs and surpasses the neckline’s level. Consider the resistance line, i.e. the gap between the first and second highs combined and the neckline. It will let you measure the take profit for every particular case. Keep on reading this guide to dive deeper into the analysis of double tops. Onwards!
What You Should Know About the Structure of Stock Double Tops
A double top on stock chart isn’t just represented by bars — you can also find its signs in line and candlestick patterns. They appear in stock, indices, forex, and other types of financial markets. For those who find short trades appealing, the analyzed bearish signal of the price movement and market overall will come in handy.
The basic hierarchy of the asset’s cost fluctuation in this case is depicted as follows:
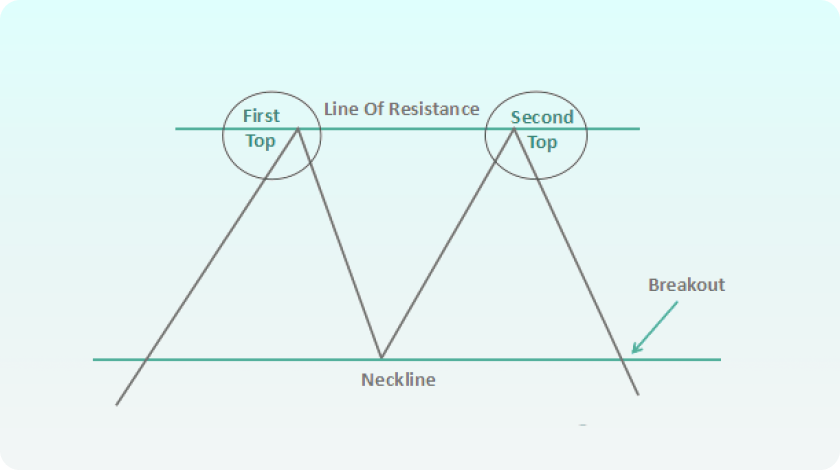
- The pattern’s peaks — it is a consecutive series of price increases before switching from highs to lows on a chart.
- A trough line — in plain English, it is an in-between mark that signifies a short-term decline in the cost of an asset.
- Neckline — that’s what helps investors distinguish correct and false signals from each other. It is a resistance and support level on a pattern and connects two peaks of the price movement in the chart.
Double Top Stock Pattern in Detail: Crucial Price Levels and Volumes
Other significant elements of a double top forex pattern boil down to:
- Price goal — it typically provides a ballpark figure for the cryptocurrency’s cost drop. This term defines an estimated custom range down from the neckline zone after the shift in prices occurs.
- Volume — with low volume, double tops have a pretty small relative significance of how the market behaves. Please don’t get it wrong — unlike what its name implies, it is just about a comparably little change in the price movement trend.
- Break of neckline — that’s where the magic behind a stock double happens. It helps verify the analysis of the market is precise and the characteristic price shift is confirmed.
To ensure that you are on the right track, take into account the price target on the chart. The length that corresponds to the separation between the two “heads” and the neckline has to match it.
Double Top Trading in a Nutshell: Peculiarities & Case Studies
Through examining real-world instances of price movement and confirmed double top in stock charts, people can learn important lessons on dos and don’ts for their trading strategies. They also can make things clearer than focusing on the theory and psychology behind this indicator. To improve your chances of a winning trade and not to miss profitable bargains based on the data in the future, double-check the information you see on the screen and apply extra parameters to verify it.
Trading Double Top Strategies for Successful Deals
When accurately detected, a double top stock chart pattern can be very effective. On the other hand, it requires utmost caution and patience before drawing any judgments. A successful and a failed double top are quite the opposite. An exceptionally bearish price move, namely, an exceptionally steep decrease in the cost of a stock, is what makes this pattern a real treasure.
If a double top in stock chart is the only indicator you see, there is a high probability to get it wrong — recognize the support level first. To stay on the safe side, it is a must to stick to the principles of stop-loss orders. Although you might not be able to win the best and most lucrative prize from the deal, it will protect you if your judgment of the trend isn’t correct. With stop-loss orders, you won’t have to track your assets daily.
Real-World Scenarios of Double Top Charts in Trading
Given how flexible and versatile the stock market is, whether it focuses on fiat money or cryptocurrencies, there are numerous cases of double top charts:
- Netflix — with double tops at around $425, its price decreased up to $380 and kept its decline to around $250 till the rapid change from the bearish to the bullish trend started in January 2019.
- Amazon — two highs at the asset’s cost of $2,050 changed their movement and decreased by 8% in 2018. The stock’s price dropped and reached a low rate of $1,880 and continued to decrease — over 30% from its initial peak price as a result.
The Overall Profile Double Tops: Quality vs. Potential Risks
Although cryptocurrency trading is a lucrative business for many, its peak results don’t come for free. A stock chart double top won’t seem an exquisite parameter in technical analysis if you don’t actually know what it means and how it acts in practice. Let’s summarize what the consequences are if double top stock chart secrets appear in the right or wrong hands.
The Benefits of Double Top Stock Analysis in Practice
If learning more about stock chart double tops seems exhausting and unnecessary, here are some reasons why changing your mind can be a good idea and a nice contribution to your career as an investor and a trader:
- It pays off as a trusted method to stimulate critical thinking rather than emotional shopping in stocks.
- It lets you set clear goals in trading. One of the key benefits is how it straightforwardly shows the market trend — it is easier to predict what will happen next in a price move.
- With precise entry and exit signals, this pattern in technical analysis and trading lets interested parties take the most out of the bearish direction of the trend.
Prospective Drawbacks of Relying on Stocks Double Top Metrics
Experts don’t recommend harnessing the data hidden in the indicators and structure of a double top chart pattern alone. It is the same precautionary measure as other ways to monitor and predict further price movement trends. It is a must to verify the trend and get a better understanding of risk mitigation strategies when it relates to creating buy-and-sell deals based on the double top’s hints.
As has been highlighted, before entering a trade, verify the chart’s validity and remember the importance of setting stops for orders. The lack of expertise or the overly confident behavior without double-checks, on the contrary, may result in financial losses because of poorly made decisions.
To sum up, the negative aspects of double tops come down to:
- As in the case with other patterns, this metric doesn’t take into consideration potential environmental changes, including economic data.
- Given double tops are popular across numerous financial markets, their behavior will be slightly different in every medium. It is essential to take into account the peculiarities of trading and tech analysis for different markets.
- No matter what, people can lack in expertise, patience, and diligence to confirm the quality of incoming signals. Their subjective nature makes trading decisions highly customizable yet dependent on the target interpretation.
Key Takeaways: Is Technical Analysis Double Top Worth It?
One of the best features of trading analysis and double tops in particular is that it assists in making well-thought-out decisions. Thanks to this strategy, enthusiasts can clearly see when it is the right moment to join or quit the market — the resistance level is quite a solid parameter for buy-and-sell deals here.
The ability to recognize double top charts is essential for traders. It has a huge impact on the investor’s skills in making wise choices and what distinguishes them from poorly prepared experts in the field. Thorough market research proves its efficiency. Traders can boost their chances of accomplishing their deals’ goals by examining and estimating the price movement through its peaks, volume, and other indicators. With the psychological standards of a trading act in mind, interested parties can identify such bearish reversals and prevent losses.